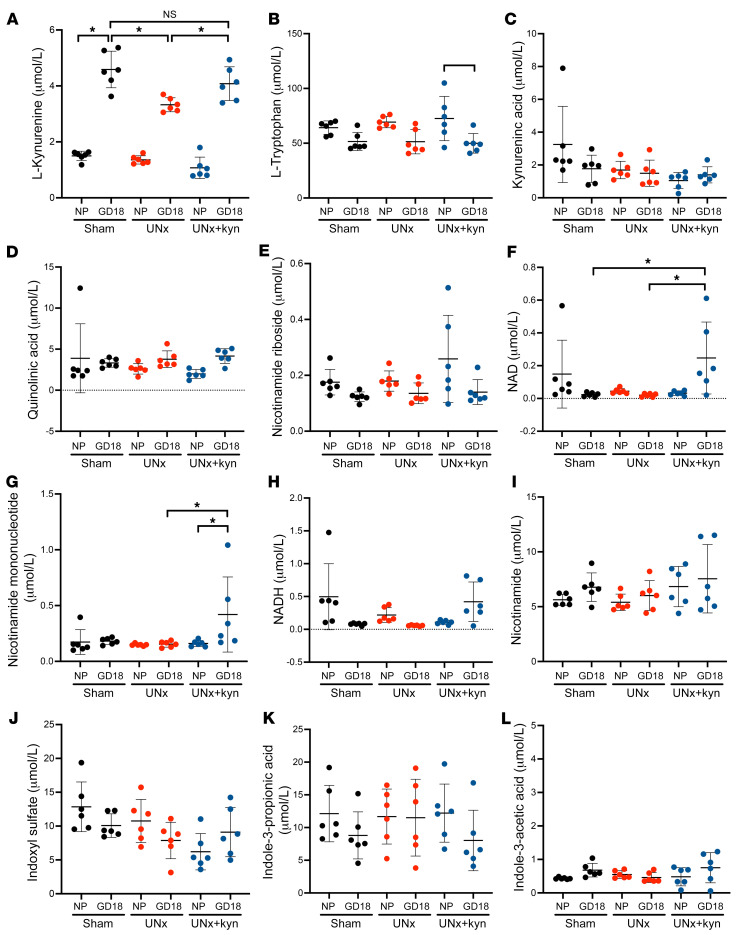
Figure 7. Quantitative levels of l-kynurenine and related metabolites by ID-MS/MS in sham-treated mice, UNx mice, and UNx+kyn mice.
Levels of l-kynurenine (A), l-tryptophan (B), kynurenic acid (C), quinolinic acid (D), nicotinamide riboside (E), NAD (F), nicotinamide mononucleotide (G), NADH (H), nicotinamide (I), indoxyl sulfate (J), indole-3-propionic acid (K), and indole-3-acetic acid (L) in the NP state and at GD18 in control, UNx, and UNx+kyn mice, as quantified by ID-MS/MS. The mean and SD of individual values are depicted for each of the metabolites. n = 6 per group. *P < 0.05, by 1-way ANOVA with Tukey’s test for multiple comparisons.

