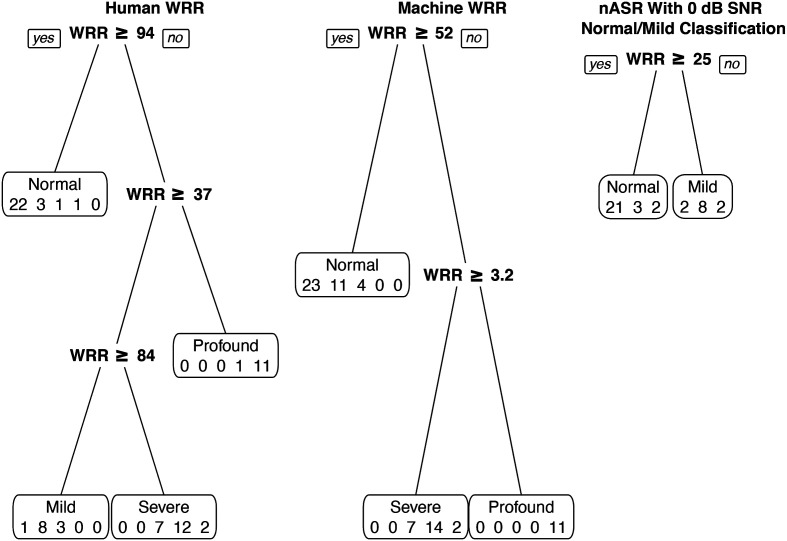
Figure 4.
Decision Trees for Human word recognition rate (WRR), Machine WRR, and noise-augmented automatic speech recognition (nASR). Pruned decision trees using classification and regression tree (CART) for Human WRR (left), Machine WRR (middle), and nASR with a 0 dB signal-to-noise ratio (SNR) for normal/mild classification. Divisions show decision thresholds for group classification. The Human WRR tree had 74% accuracy; the Machine WRR tree had 67% accuracy; the nASR tree had 76% accuracy for the normal and mild groups. For the nASR tree, samples were chosen for classification using the noise-mixed signal if the Machine WRR CART classified them as normal (Machine WRR ≥ 52). Each box displays the predicted severity group with the number of actual speakers in each severity group predicted for that group (normal, mild, moderate, severe, and profound) for the Human WRR and Machine WRR trees; (normal, mild, and moderate) for the nASR tree.

