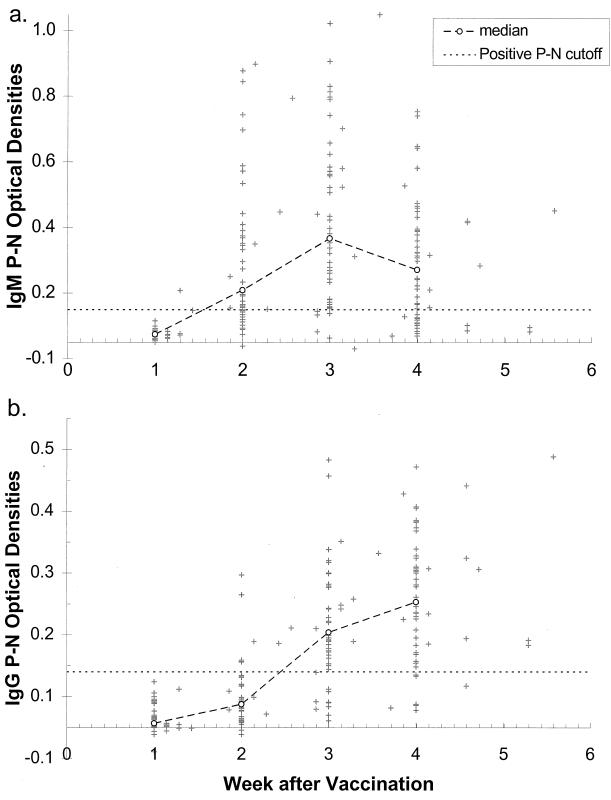
FIG. 1.
(a) Difference in IgM optical densities of positive and negative (P − N) wells for each infant by week after measles vaccination. The larger dashed line represents the 50th percentile for each week (a week was defined as a multiple of 7 ± 3 days; e.g., week 2 = 11 to 17). The horizontal dashed line represents the cutoff P − N value of 0.10, which was used in combination with the P/N ratio to determine whether the specimen was considered IgM positive, IgM borderline, or IgM negative. (b) Difference in IgG optical densities of P − N wells for each infant by week after vaccination. As in panel a, the larger dashed line represents the 50th percentile for each week, and the horizontal dashed line represents the cutoff P − N value of 0.09. Both graphs include only data for infants who were both IgM and IgG negative before vaccination.

