Figure 1.

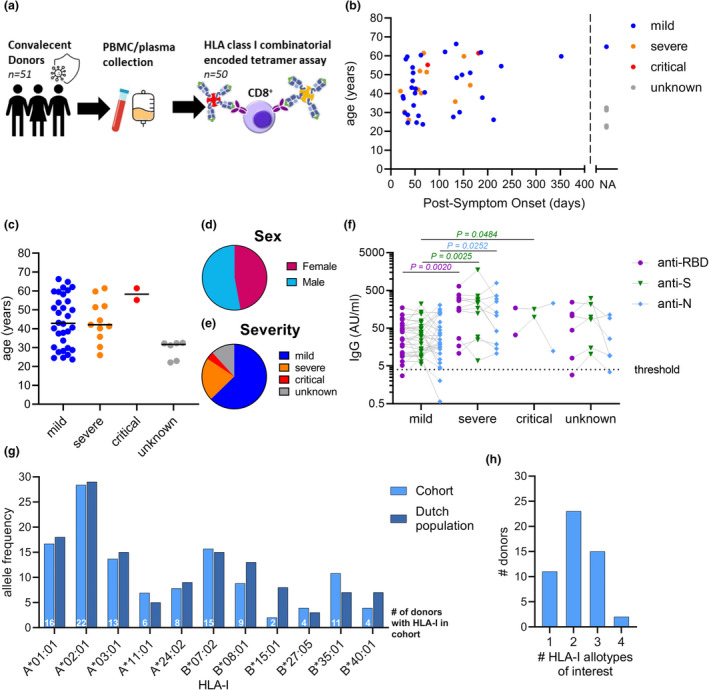
Convalescent COVID‐19 donor cohort and seroconversion. (a) Overview of convalescent donor cohort and study design. Distribution of days postsymptom onset (b), age (c), sex (d) and disease severity (e). Each dot represents an individual (n = 51 in total) (b, c). Donor with unspecified days postonset symptoms or severity was set as not available (NA; n = 7) (b) or unknown (n = 6) (c), respectively. (f) Plasma IgG titres to SARS‐CoV‐2 RBD, spike (S) and nucleocapsid (N) stratified per severity group; dotted line indicates the seroconversion threshold, and individual donors were connected by lines. Statistical significance between severity groups was determined with the unpaired Mann–Whitney U‐test, considering P‐values < 0.05 as significant. (g) Allelic frequency of 11 HLA‐I allotypes of interest in cohort (n = 51) compared with the general Dutch population obtained from the Allele Frequency Net Database (AFND; n = 1305). (h) Number of simultaneous expressed HLA‐I allotypes of interest across our cohort.
