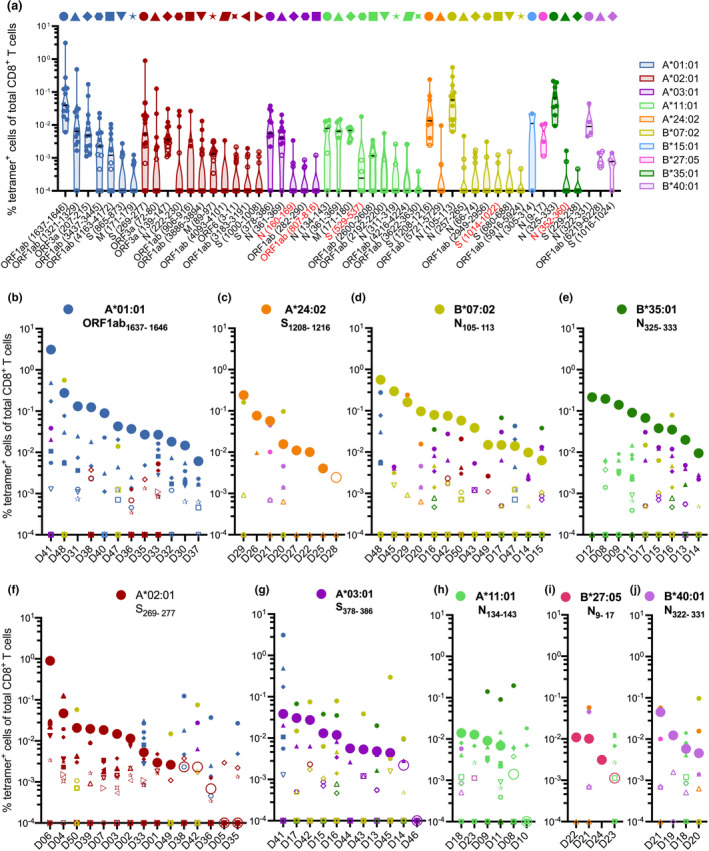
Figure 4.

Frequency and immunodominance landscapes of SARS‐CoV‐2‐specific CD8+ T cell epitopes in convalescent donors. (a) Frequency of tetramer+CD8+ T cells for SARS‐CoV‐2 epitopes, each dot represents an individual donor, and epitopes are ordered based on mean frequency per HLA‐I. Colours correspond to different HLA‐I restrictions. Tetramer+CD8+ T cells detected at < 9 cells counted within a dual‐positive gate are indicated by open symbols (Supplementary figure 4) and were excluded from phenotypic analysis. Bar indicates median. (b–j) Immunodominance landscapes of single SARS‐CoV‐2 epitope‐specific CD8+ T cell populations in individual donors grouped based on their HLA‐I expression. Unique symbol/colour combinations are assigned for each individual epitope as indicated by the caption above (a). Graphs (b–j) are ordered based on the mean frequency of the epitope with the highest mean frequency for the respective HLA (large circles) identified in a.
