
Figure 5.
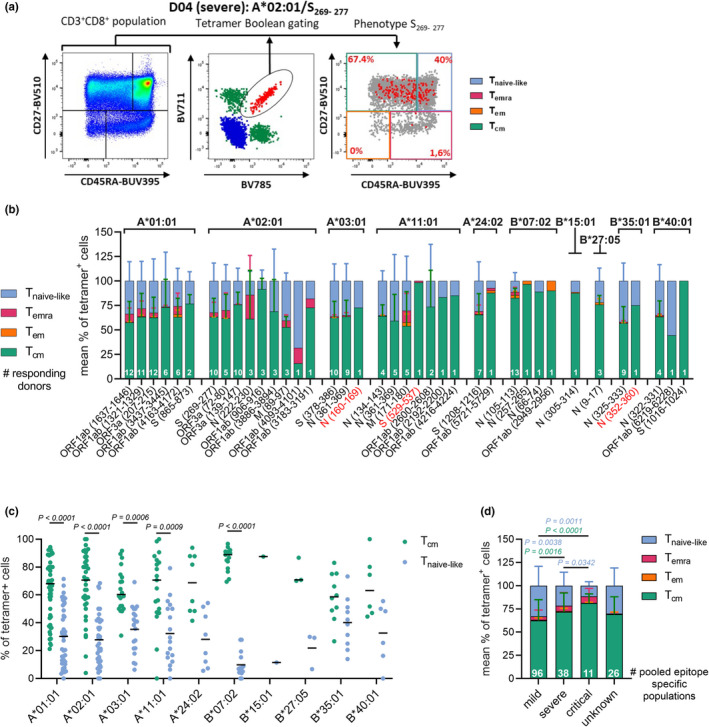
SARS‐CoV‐2 epitope‐specific CD8+ T cells display a clear memory phenotype. (a) Representative FACS panels indicate the gating strategy used to characterise the phenotype profile of SARS‐CoV‐2 epitope‐specific CD8+ T cells. CD27 and CD45RA were used to identify Tcm (CD27+CD45RA−), Tem (CD27−CD45RA−), Temra (CD27−CD45RA+) and Tnaive‐like (CD27+CD45RA+) cells. Gates were set based on the total CD8+ T cell population (left panel). The right panel displays a combination of total CD8+ T cells (grey dots) with dual‐tetramer‐positive cells (red dots) (b) Mean phenotypic frequencies of SARS‐CoV‐2 epitope‐specific CD8+ T cells pooled donors per epitope. (c) Tcm and Tnaive frequencies of tetramer+CD8+ T cells, populations of multiple donors and epitopes with the respective HLA‐I restriction were pooled. (d) Mean phenotypic frequency of tetramer+CD8+ T cells per severity group. Mean (c) and SD (b, d) are shown and statistical significance was determined using the Wilcoxon (c) or the Mann–Whitney U‐test, considering P‐values < 0.05 as significant (d).