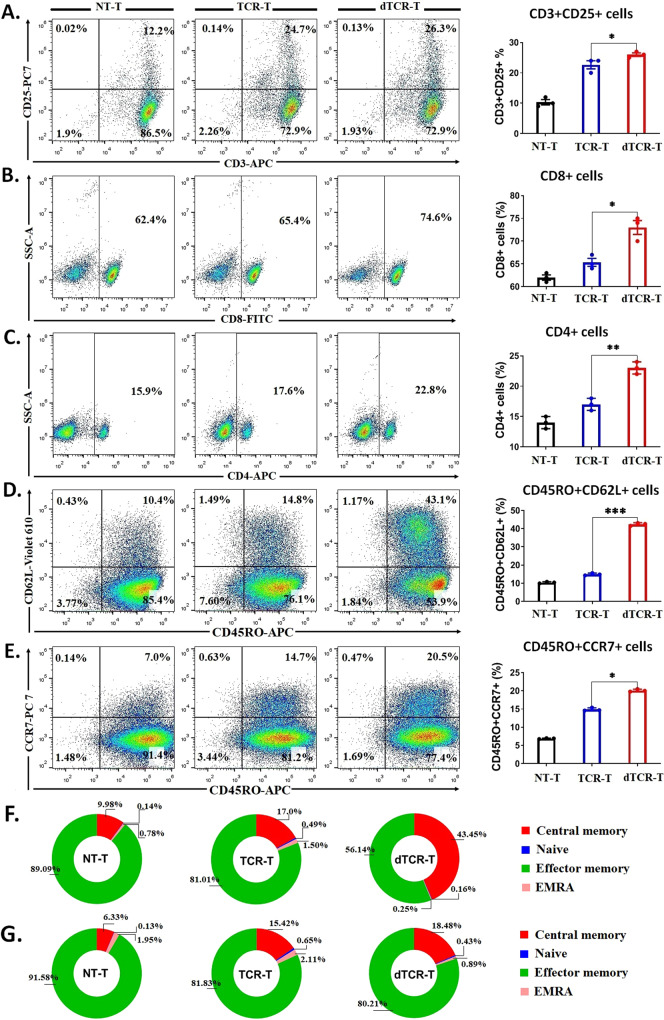
Fig. 4. dTCR-T cells exhibit an improved memory phenotype under NY-ESO-1-specific stimulation.
Phenotypic representation of (A) activation-associated CD3+CD25+ T cells, cytotoxic (B) CD8+ and (C) CD4+ cells, and central memory (D) CD45RO+CD62L+ T cells, and (E) CD45RO+CCR7+ T cells of NT-T, TCR-T, and dTCR-T cells from 12 days of the bulk cell culture (three healthy donors). F, G Pie chart showing the proportion of T-cell subsets, including central memory (CM; CD45RO+CD62L+/CCR7+), naive (CD45RO-CD62L+/CCR7+), effector memory (EM; CD45RO+CD62L-/CCR7-), and highly differentiated effector memory (EMRA; CD45RO-CD62L-/CCR7-) cells from panels D and E. The data are presented as mean ± sd (n = 3). Statistical comparisons between dTCR-T and TCR-T groups were determined by two-tailed unpaired t tests. *P < 0.05; **P < 0.01; ***P < 0.001.

