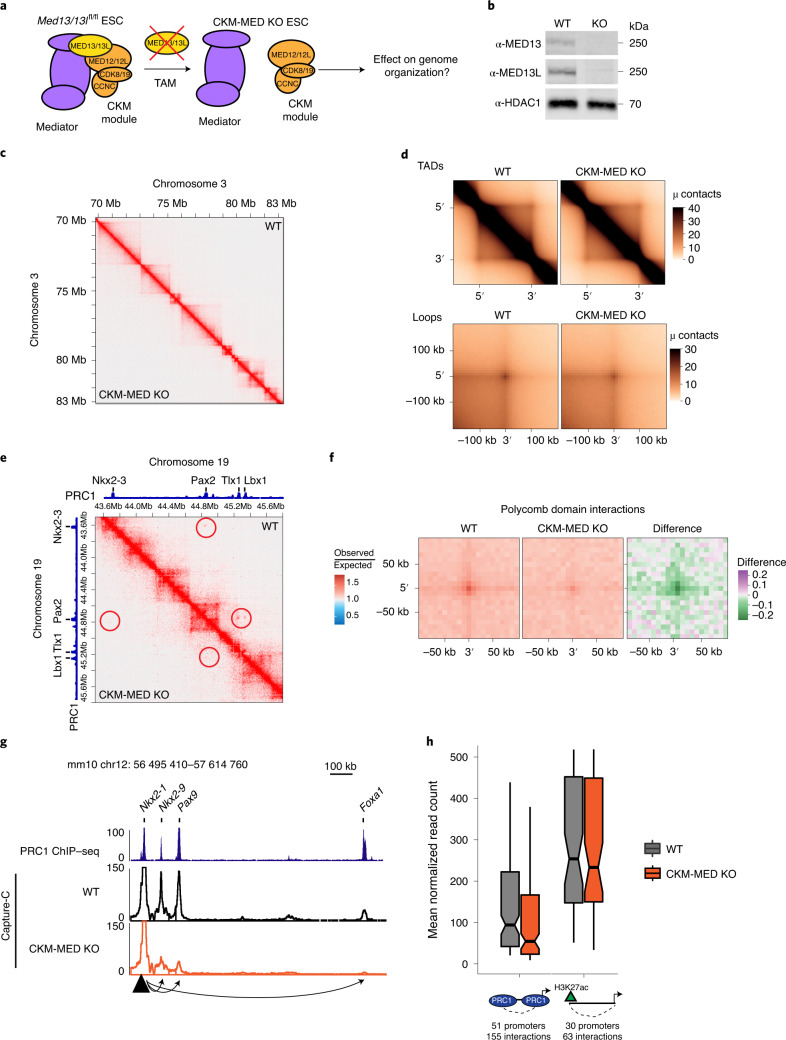
Fig. 1. CKM–Mediator has a limited role in 3D genome organization but is essential for Polycomb domain interactions.
a, A schematic of Med13/13lfl/fl ESCs. 4-Hydroxytamoxifen (TAM) induces conditional disruption of the CKM–Mediator complex (CKM–MED). b, A representative western blot analysis (n = 6) of nuclear extracts from Med13/13lfl/fl (wild type, WT) and Med13/13l−/− (CKM–MED KO) ESCs showing depletion of MED13 and MED13L proteins. HDAC1 is shown as a loading control. c, Hi-C contact matrices of WT and CKM–MED KO ESCs at 10 kb resolution. Genomic coordinates are indicated. d, Aggregate analysis of TADs and loops in WT and CKM–MED KO ESCs at 10 kb resolution. e, Hi-C contact matrices of WT and CKM–MED KO ESCs at 5 kb resolution. Interactions between Polycomb domains are indicated with a red circle. The blue track shows binding of PRC1 (RING1B ChIP–seq). Genomic coordinates are indicated. f, Aggregate analysis of Hi-C signal (10 kb resolution) at pairs of Polycomb domains in Med13/13lfl/fl (WT) and Med13/13l−/− (CKM–MED KO) ESCs, with 200 kb flanking regions. The difference between WT and KO is shown. g, A snapshot showing Capture-C read count signal in WT and CKM–MED KO ESCs. Interactions between the Nkx2-1 promoter bait (triangle) and surrounding Polycomb-bound sites are shown with arrowheads. PRC1 binding (RING1B ChIP–seq) is shown as a reference. h, Boxplot analysis of mean normalized read counts from WT and CKM–MED KO ESCs showing interactions between Polycomb gene promoters and other Polycomb domains (left), or non-Polycomb gene promoters and active sites (H3K27ac, right). Interactions were not distance-matched due to differences in the interaction ranges for the two promoter types. Boxes show IQRs, center line represents median, whiskers extend by 1.5 × IQR or the most extreme point (whichever is closer to the median), while notches extend by 1.58 x IQR/sqrt(n), giving a roughly 95% confidence interval for comparing medians.

