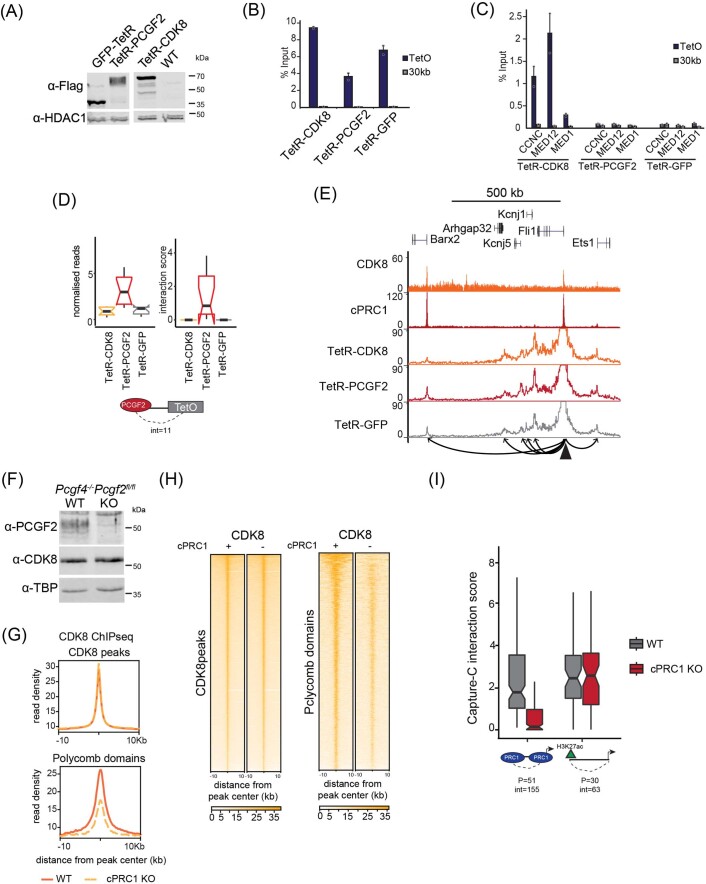
Extended Data Fig. 3. cPRC1 creates interactions between Polycomb domains.
a, A representative Western blot analysis (n = 3) of nuclear extracts from the TetR-fusion lines used for Capture-C analysis probed with anti-Flag antibody to detect expression of the fusion proteins. HDAC1 is used as a loading control. b, ChIP-qPCR analysis of binding of the different TetR-fusion lines to the TetO array. Data are presented as mean value (n = 2) ±SD. Data points for individual replicates are shown. c, ChIP-qPCR analysis of binding of the CKM-Mediator complex to the TetO array in the TetR-CDK8, TetR-PCGF2, and TetR-GFP lines.. Data are presented as mean value (n = 2 for TetR-CDK8 and n = 3 for TetR-PCGF2 and TetR-GFP) ± SD. Data points for individual replicates are shown. d, Boxplot analysis of Capture-C mean normalised read counts and interaction scores in the TetR-fusion lines, looking at interactions with Polycomb domains (PCGF2-bound). Number of interactions is shown. Boxes show interquartile range, center line represents median, whiskers extend by 1.5x IQR or the most extreme point (whichever is closer to the median), while notches extend by 1.58x IQR/sqrt(n), giving a roughly 95% confidence interval for comparing medians. e, Snapshots showing Capture-C read count signal from TetR-CDK8, TetR-PCGF2 and TetR-GFP lines at a control locus. CDK8 and PCGF2 (cPRC1) ChIPseq signal is given as a reference. The Fli1 promoter bait is shown as a triangle and interactions created with surrounding cPRC1-bound sites are represented with arrowheads. f, A representative Western blot analysis of nuclear extracts (n = 3) from WT and cPRC1 KO ESCs probed with the indicated antibodies. TBP is used as a loading control. g, Metaplot analysis of CDK8 enrichment at CDK8 peaks (n = 24275) and Polycomb domains (n = 2097) in WT and cPRC1 KO ESCs. h, Heatmaps showing CDK8 ChIPseq signal at CDK8 peaks (n = 24275) and Polycomb domains (n = 2097) in WT and cPRC1 KO ESCs, sorted by decreasing CDK8 or RING1B signal, respectively. i, Boxplot analysis of Capture-C interaction scores from WT and cPRC1 KO ESCs showing interactions between Polycomb gene promoters and other Polycomb-domains (left), or non-Polycomb gene promoters and active sites (H3K27ac, right). Number of promoters (P) and interactions (int) is shown. Boxes show interquartile range, center line represents median, whiskers extend by 1.5x IQR or the most extreme point (whichever is closer to the median), while notches extend by 1.58x IQR/sqrt(n), giving a roughly 95% confidence interval for comparing medians.

