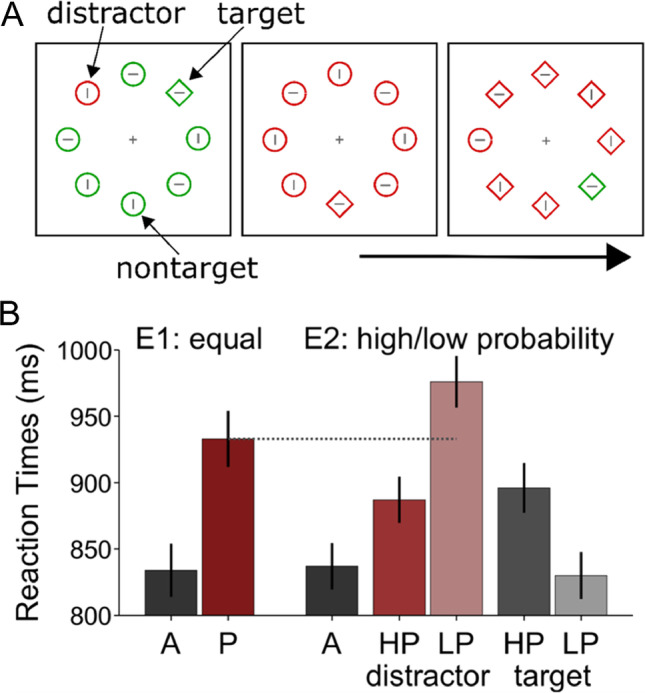
Fig. 1.

Panel a shows an illustration of the experimental stimuli (drawn to scale). Panel b shows the reaction time results from Experiments 1 and 2 (E1, E2). In Experiment 1, the probability of distractor or target presentations on each of the eight positions was equal. In Experiment 2, the distractor or target could be shown on the high-probability distractor position or on one of the low-probability distractor positions. Black or gray bars indicate means from distractor-absent conditions. Reddish bars indicate means from distractor-present conditions. Error bars show the between-participant standard error. A = distractor-absent; P = distractor-present; HP = high-probability distractor position; LP = low-probability distractor position. (Color figure online)
