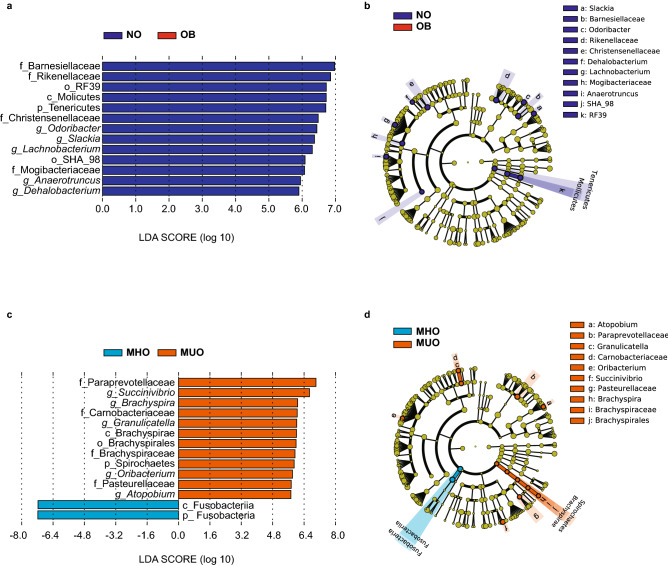
Figure 3.
Linear discriminant analysis (LDA) score distribution of microbiome between (a) NO; non-obese (blue) and OB; obese (red), and (c) MHO; metabolically healthy obese (light blue) and MUO; metabolically unhealthy obese (orange). Alphabetical letters listed before the name of the enterobacteria represent p_; phylum, c_; class, o_; order, f_; family, and g_; genus levels. Linear discriminant analysis effect size (LEfSe) analyses of gut microbiota and Cladogram indicating statistical differences of the microbial populations between (b) NO; non-obese (blue) and OB; obese (red), and (d) MHO; metabolically healthy obese (light blue) and MUO; metabolically unhealthy obese (orange). Cladograms show the phylogenetic distribution of bacterial lineages associated with groups from kingdom, phylum, class, order, family, and genus levels are listed in kingdom from inside to outside of the cladogram. NO; non-obese (blue) (n = 81), OB; obese (red) (n = 59), MHO; metabolically healthy obese (light blue) (n = 54) and MUO; metabolically unhealthy obese (orange) (n = 21). Graphics were made using the Galaxy/Hutlab (https://huttenhower.sph.harvard.edu/galaxy/). p < 0.05, LDA score > 5.5.

