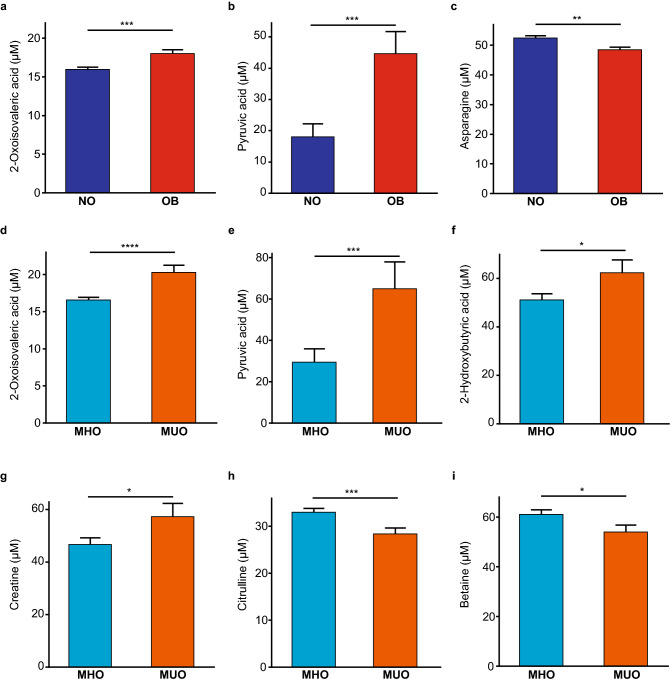
Figure 5.
(a–c) Composition of selected metabolites in serum of NO and OB. (d–i) Composition of metabolites in serum of MHO and MUO. NO; non-obese (blue) (n = 81), OB; obese (red) (n = 59), MHO; metabolically healthy obese (light blue) (n = 54) and MUO; metabolically unhealthy obese (orange) (n = 21). Data are shown as mean ± SEM. Data were analyzed using unpaired t-test to compare groups. *p < 0.05; **p < 0.01; ***p < 0.001; ****p < 0.0001.

