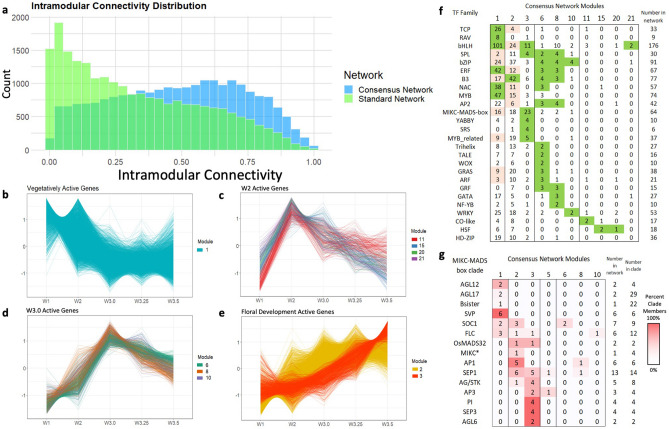
Figure 2.
Co-expression networks showing the dominant transcriptional profiles during wheat inflorescence development. (a) Histogram of intramodular connectivity scores for 22,566 genes clustered in consensus (blue) or standard (green) network. (b–e) Expression profiles during inflorescence development of discussed modules in the consensus network. Lines represent scaled time course expression of each gene in the module. Modules with similar expression profiles are grouped together for comparison. (f) Number of TF family members clustered in each discussed consensus module. Modules enriched (green) or depleted (pink) for TF families are highlighted (P < 0.01). (g) Number of MIKC-MADS box clade members clustered in each consensus modules. Co-expressed MIKC-MADS box groups are shaded relative to the total number of genes in the clade.

