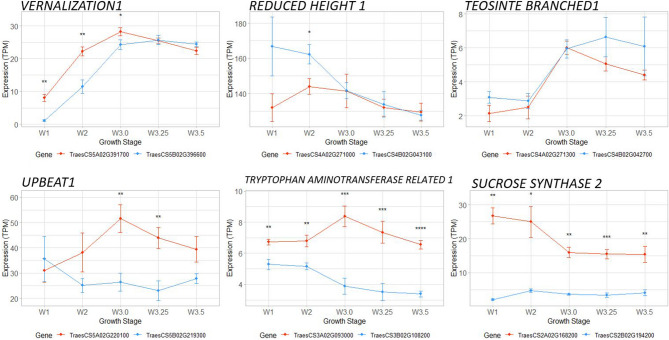
Figure 4.
Divergent expression of homoeologous gene pairs during inflorescence development. Examples include the expression profiles of characterized domestication and adaptation alleles and genes close to QTL for spike architecture or grain size. Expression values are in TPM ± standard error. A-genome homoeologs are in orange, B-genome homoeologs are in blue. Paired t-tests were used to indicate differences between homoeolog expression at each time point, P values < 0.05 (*), 0.01 (**), 0.001 (***), 0.0001 (****).

