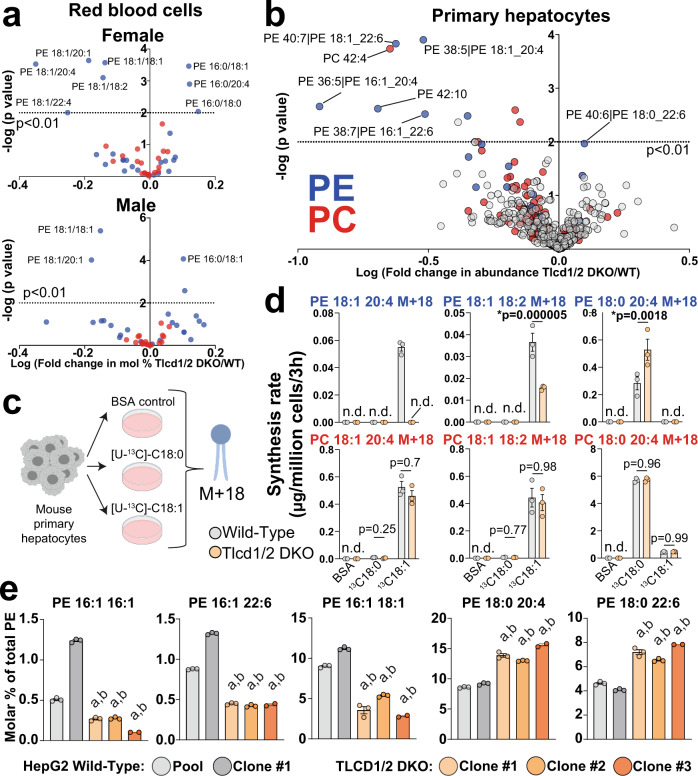
Fig. 2. TLCD1/2 promote MUFA incorporation into PE species in a cell-intrinsic manner.
a Volcano plots of selected PC (19 species, red) and PE (26 species, blue) species measured in red blood cells isolated from 8-month-old male (n = 12 WT, 11 Tlcd1/2 DKO) and female (6 WT, 9 Tlcd1/2 DKO) mice. b Volcano plot of lipid species measured with high confidence (492 species in total, PC indicated in red and PE in blue) in primary hepatocytes isolated from Wild-type and Tlcd1/2 DKO chow-fed, 3-month-old female mice (n = 3 mice/genotype) after 2 days of culture. c Outline of PE pulse-labeling experiment. d The levels of indicated PE and PC species containing stable label (mass + 18 Da) in primary hepatocytes isolated from wild-type and Tlcd1/2 DKO chow-fed, 3-month-old female mice (n = 3 mice/genotype), treated with 100 µM [U-13C]−18:0 or −18:1 for 3 h. e The levels of indicated PE species (expressed as molar % of total measured PE) measured in a pool or single clone-derived HepG2 cells transfected with non-targeting gRNA, and in CRISPR-edited TLCD1/2 DKO three single clone-derived cell populations. N = 3 technical replicates per sample. In d, e, data are presented as mean values ± SEM. In a, b, the logarithms of multiple unpaired two-tailed student’s t-test p values (not adjusted for multiple comparisons) are plotted on the y axis. In d, two-way ANOVA Sidak’s multiple comparisons post-hoc test p values are indicated on graphs, and n.d. indicates undetectable levels of measured lipid. In e, a indicates p < 0.0001 vs wild-type pool, and b—p < 0.0001 vs wild-type clone 1 using one-way-ANOVA with Sidak’s multiple comparisons post-hoc test. Source data for a, b, d, e are provided as a Source Data file.

