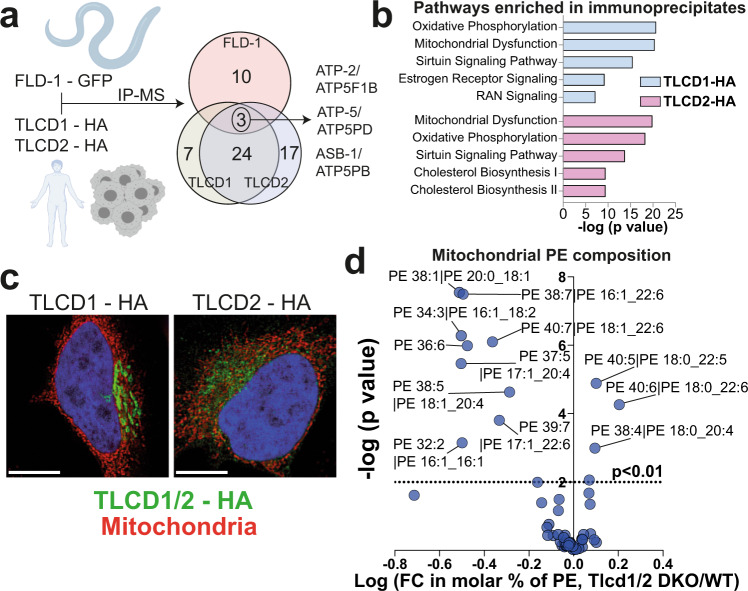
Fig. 3. TLCD1/2 interact with mitochondria and regulate hepatocyte mitochondrial PE composition.
a Design and summary of GFP-FLD-1 and HA-TLCD1/2 IP experiments performed in C. elegans GFP-FLD-1 strains (n = 4 biological replicates) and in HepG2 cells with stable HA-TLCD1 or HA-TLCD2 expression (n = 5 clones/condition). IP-MS: immunoprecipitation followed by mass spectrometry. Overlapping hits (ATP synthase subunits) are indicated. b Ingenuity Pathway Analysis (using genome-wide proteome reference database) of the interacting proteins enriched in either HA-TLCD1 or HA-TLCD2 HepG2 IPs compared to negative controls. The list of protein hits for each pathway are provided in the Supplementary data 2. c Representative (from 2 independent experiments, each containing >100 imaged individual cells) IHC images of HeLa cells with stable HA-TLCD1 and HA-TLCD2 expression, co-stained for HA tag (FITC) and mitochondria (Deep Red FM). White scale bar = 20 µm. d Volcano plot of PE species measured with high confidence (expressed as molar % of total PE species for each sample) in mitochondria isolated from the livers of wild-type and Tlcd1/2 DKO chow-fed, 3-month-old male mice (n = 7 mice/genotype). In b, p values were calculated by Ingenuity Pathway Analysis software. In d, the logarithms of multiple unpaired two-tailed student’s t-test p values (not adjusted for multiple comparisons) are plotted on the y axis. Source data for d are provided as a Source Data file.

