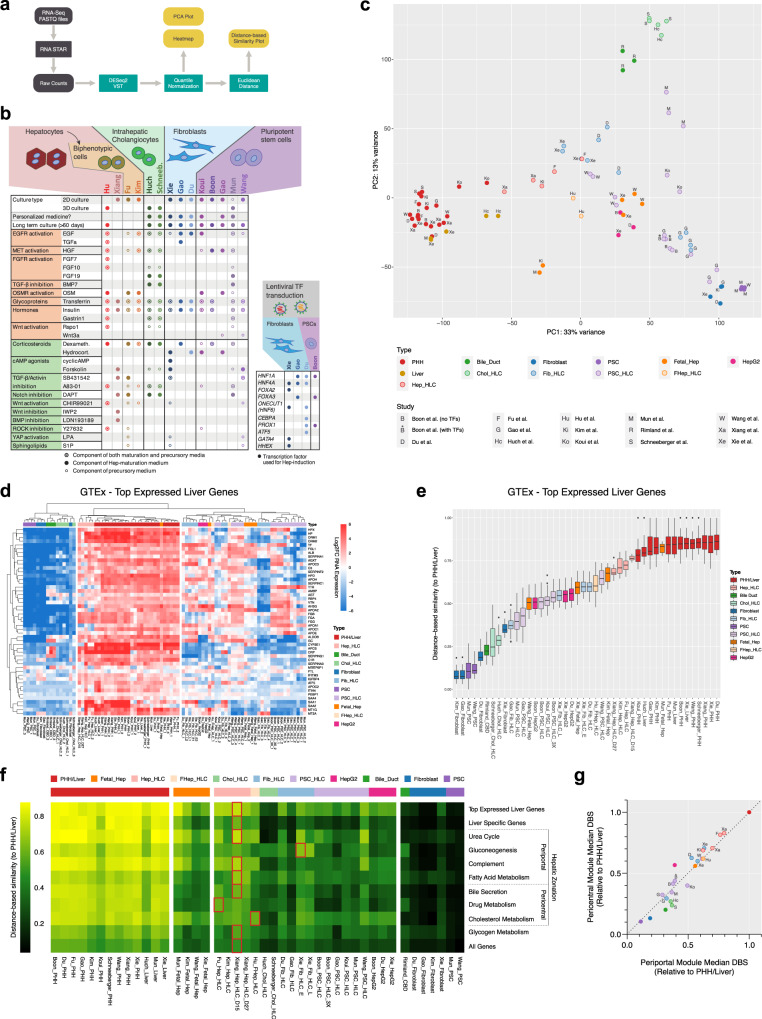
Fig. 2. Transcriptomic comparison reveals distinct liver-specific molecular signatures in HLCs.
a Schematic of the algorithm employed to conduct the transcriptomic comparison analysis. All steps in gray were performed on the Galaxy web platform. b Summary of protocols used to generate HLCs that were included in the transcriptomic comparison analysis. Precursory medium is any medium that was used directly prior to the final maturation medium, including progenitor/expansion medium (hepatocyte-, cholangiocyte-, and fibroblast-derived HLCs) and hepatocyte differentiation medium (PSC-derived HLCs). c Principal component analysis created using 5000 genes with the highest variance among all samples from different studies. d Heatmap of top-expressed liver genes according to the Genotype-Tissue Expression (GTEx) project. Hierarchical clustering was performed using Euclidean distance. e Distance-based similarity score (DBS) calculated using Euclidean distance describing the resemblance between each sample to all PHH/Liver samples based on the top-expressed liver gene set. Box-and-whisker plots are shown as median (line), interquartile range (box), and data range or 1.5x interquartile range (whisker). f Heatmap showing the median DBS of all samples using various liver function associated gene sets. Red outlines indicate the HLC with the highest DBS for each gene set. g The median DBS of all samples relative to PHH/Liver based on the pericentral and periportal modules (see Fig. 2c for legend). Source data are provided in Supplementary Data 4 and 5.

