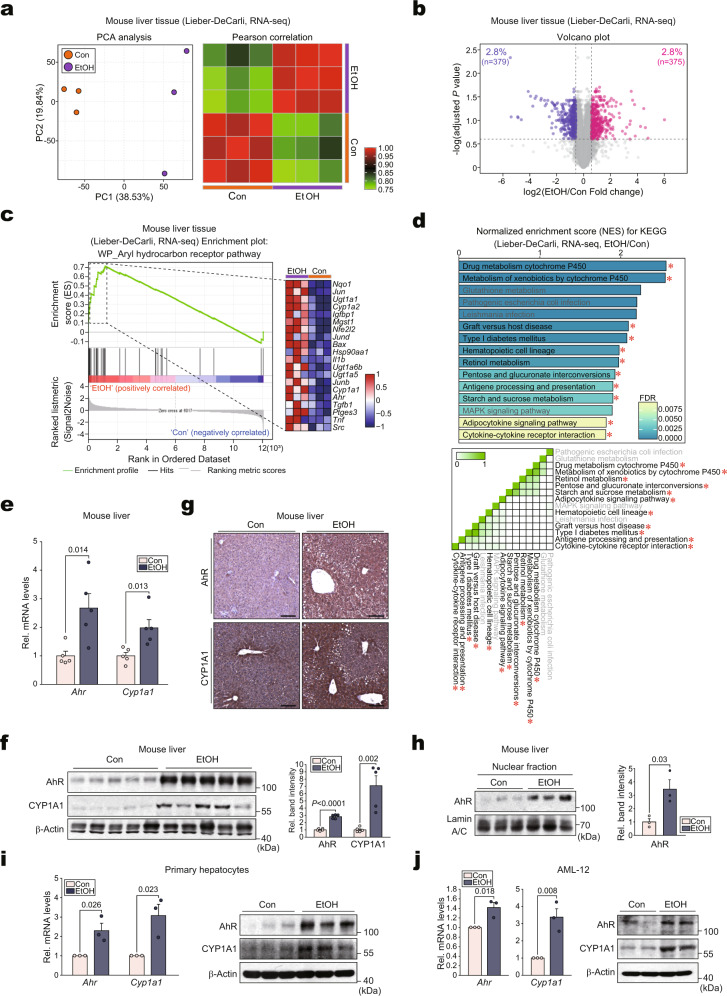
Fig. 1. Activation of AhR in hepatocytes by alcohol.
a PCA score plot (left) and Pearson correlation matrix heatmap (right) of the hepatic transcriptome data obtained from mice fed with either a control diet or a Lieber-DeCarli alcohol liquid diet for 5 weeks (n = 3 each; darker green, closer negative correlation; darker red, closer positive correlation). b Volcano plot of DEGs using the same data as in (a) (blue, downregulated; red, upregulated; DEGs with adjusted P value <0.25 and absolute FC >1.5). c GSEA-enrichment plot of the AhR pathway (WikiPathways, WP) from the same data as in (a) (NES = 2.23, FDR <0.0001). The top 20 genes comprising the leading-edge of the enrichment score are shown in the corresponding heatmap (darker blue, stronger downregulation; darker red, stronger upregulation). d Bar graph (upper) and leading-edge analysis (lower) of the significantly enriched GSEA KEGG pathway using the same data as in (a). NES and FDR are presented as a bar graph (NES >1.81, FDR <0.01) (upper). The results from GSEA leading-edge analysis are shown as a similarity matrix where the intensity of the green color directly correlates with the extent of the intersection between the leading-edge core genes of each gene set combination (lower). AhR-related pathways were marked with red asterisks. e–g qRT-PCR, immunoblotting, and immunohistochemical analyses for AhR and CYP1A1 in the liver of mice fed the Lieber-DeCarli diet for 4 weeks (n = 5 each). Representative images were shown for (g). Scale bar: 100 μm. h Immunoblot analyses for nuclear fractions prepared from liver samples of mice subjected to the Lieber-DeCarli diet for 4 weeks (left) and their quantifications (right) (n = 3 each). i, j qRT-PCR (left) or immunoblot (right) assays for AhR and CYP1A1 in mPHs isolated from the mice fed as indicated in (a) (i; n = 3 each). AML-12 cells were treated with 100 mM ethanol for 48 h (j; repeated three times with similar results). Values are expressed as means ± SEM. Significantly different compared to the controls. The data were analyzed via a two-sample two-tailed t-test with the Benjamini–Hochberg correction for an adjusted P value (b) or two-tailed Student’s t-tests (e, f, h–j). Source data are provided as a Source Data file.

