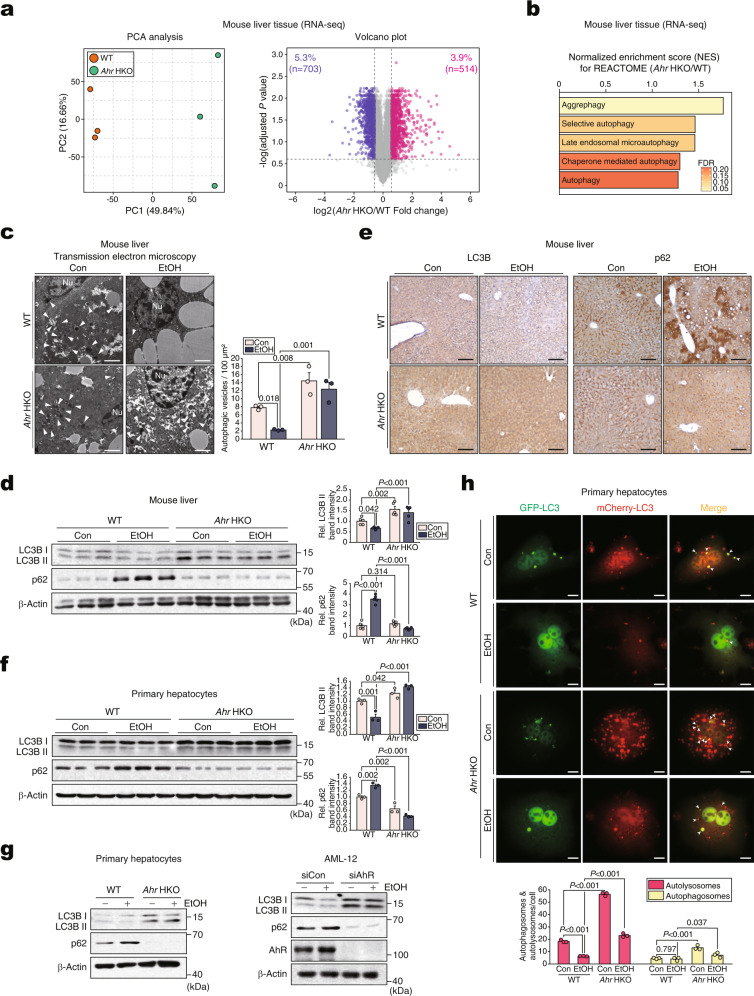
Fig. 2. Augmentation of autophagy flux by hepatocyte-specific Ahr deficiency in mice.
a PCA score plot (left) and volcano plot (right; blue, downregulation; red, upregulation) of DEGs based on the hepatic transcriptome data using WT or Ahr HKO mice (n = 3 each; DEGs of adjusted P value <0.05 and absolute FC >1.5). b Autophagy-related pathways based on GSEA REACTOME analysis using the same data as in (a). FDR and NES are presented as a bar graph (NES >1.25, FDR <0.25). c Representative TEM (Nu, nucleus) in the liver of mice subjected to a control diet or Lieber-DeCarli diet for 5 weeks (left) and their quantifications (right) (n = 3 each). The arrows indicate autophagic vesicles containing organelle remnants. Scale bar: 2 μm. d Immunoblots of the liver homogenates of mice fed as in (c) (left) and their quantifications (right) (n = 5 each). e Representative immunohistochemical images for LC3B (left) and p62 (right) using the same mice as in (d) (n = 5 each). Scale bar: 100 μm. f Immunoblots in mPHs isolated from the mice fed as in (c) (left) and their quantifications (right) (n = 3 each). g Immunoblots for LC3BI/II and p62 in the lysates of mPHs treated with 100 mM ethanol for 48 h (left) or AML-12 cells treated with 100 mM ethanol for 48 h after transfection with siAhR (or siCon) for 24 h (right) (repeated three times with similar results). h Representative confocal microscopic images of mCherry/GFP-LC3B puncta staining (upper) and their quantifications (lower) (n = 3 each, 10 cells/group for each experiment). To collect confocal images of yellow (autophagosomes) or red (autolysosome) puncta, mPHs were infected with Ad-mCherry-GFP-LC3B for 12 h and then exposed to 100 mM ethanol (or Con) for 48 h. Scale bar: 10 μm. Values are expressed as means ± SEM. Significantly different compared to the control or WT. The data were analyzed via a two-sample two-tailed t-test with the Benjamini–Hochberg correction for an adjusted P value (a) or one-way ANOVA with LSD (c, d, f, h). Source data are provided as a Source Data file.

