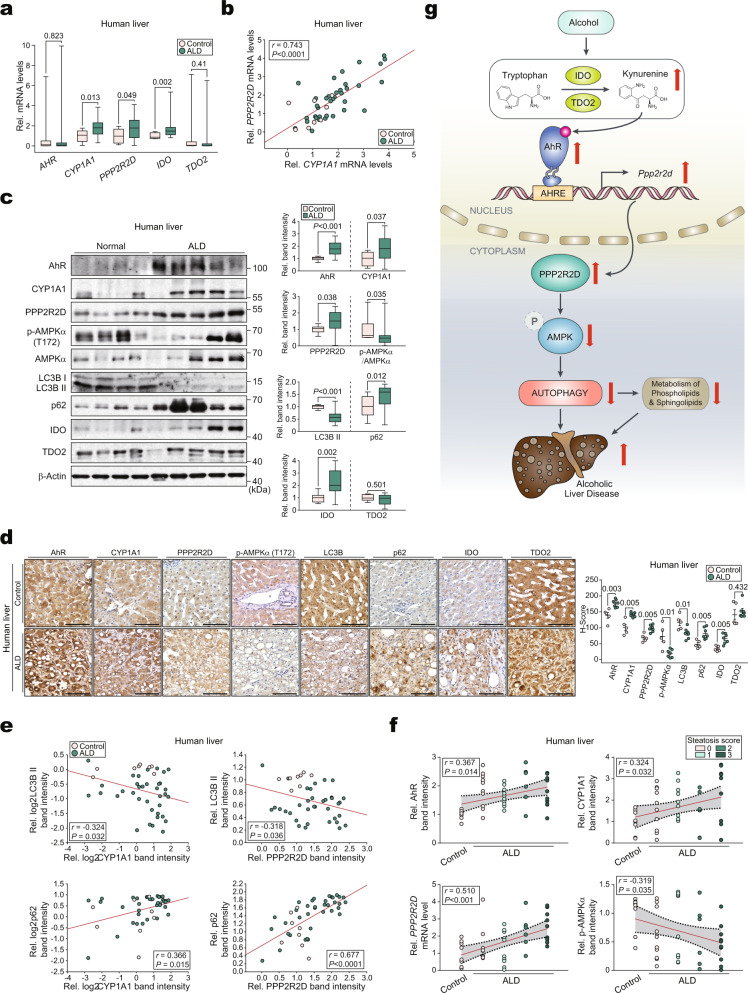
Fig. 7. Analyses of identified AhR targets in the livers of ALD patients.
a qRT-PCR assays for AHR or other identified targets in the liver biopsy samples from ALD patients (control: n = 8, ALD: n = 36). Data values in box-and-whisker plots indicate median (mid-line), boxes indicating the Q1 and Q3 ranges, and the whiskers as minimum and maximum values. b Correlations between CYP1A1 and PPP2R2D using the same data as in (a). Each point represents one sample (control: n = 8, ALD: n = 36). c Immunoblots of the newly-identified AhR targets or autophagy markers using the same human samples as in (a) (left) and their quantifications (right) (control: n = 8, ALD: n = 36). Data values in box-and-whisker plots indicate median (mid-line), boxes indicating the Q1 and Q3 ranges, and the whiskers as minimum and maximum values. d Representative immunohistochemical images of the newly-identified targets or autophagy markers in the liver specimens from ALD patients (left) (control: n = 5, ALD: n = 7) and their H-scores (right). Scale bar: 100 μm. e Correlations between CYP1A1 (or PPP2R2D) and autophagy markers using the same data as in (c). Each point represents one sample (control: n = 8, ALD: n = 36). f Linear regression analysis between histologic steatosis score (0–3) and expression level of AhR (RMSE = 0.544), CYP1A1 (RMSE = 0.981), PPP2R2D (RMSE = 0.932), or p-AMPKα (RMSE = 0.448) using the same data as in (a) or (c). The red line is the regression line, and the gray area between the black dotted lines indicates the 95% confidence intervals of the fit. Each point represents one sample (control: n = 8, ALD: n = 36). g Proposed scheme illustrating the mechanism by which alcohol overexpression of AhR dysregulates autophagy in hepatocytes. Values are expressed as means ± SEM. Significantly different compared to Control. Data were analyzed by two-tailed Student’s t-test (part of both a and c), two-tailed Mann–Whitney test (part of both a and c and d), two-tailed Pearson correlation (b, part of e, and f), or two-tailed Spearman correlation (part of e). Source data are provided as a Source Data file.

