Figure 7.

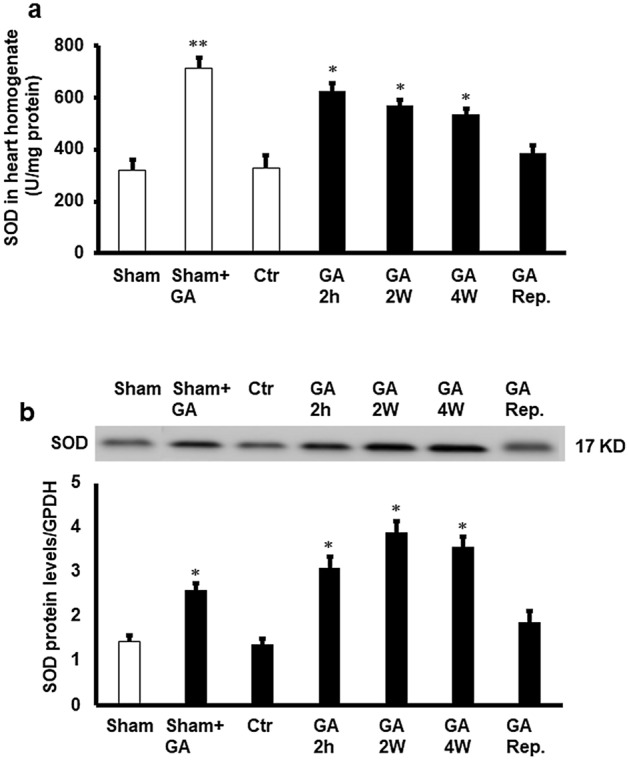
Estimation of antioxidant enzyme SOD. (a) SOD protein activity the cardiomyocytes (n = 4). (a) SOD protein levels in the cardiomyocytes (n = 4). Top: Western blot showing the protein levels of SOD corrected to GAPDH. Bottom: SOD protein levels corrected to GAPDH. SOD in cardiac muscle samples after GA administration for 2 weeks, 4 weeks, or 2 h before sacrifice or at reperfusion compared to the levels in the control group (n = 4). Ctr control, GA 2 h Gum Arabic infusion 2 h before sacrifice, GA 2 W Gum Arabic administration for 2 weeks, GA 4 W Gum Arabic administration for 4 weeks, GA Rep. Gum Arabic infusion at reperfusion. *P < 0.01 compared to control and **P < 0.01 compared to control and vehicle treated sham. Full length gels were included in supplementary figure (Fig. 7S).
