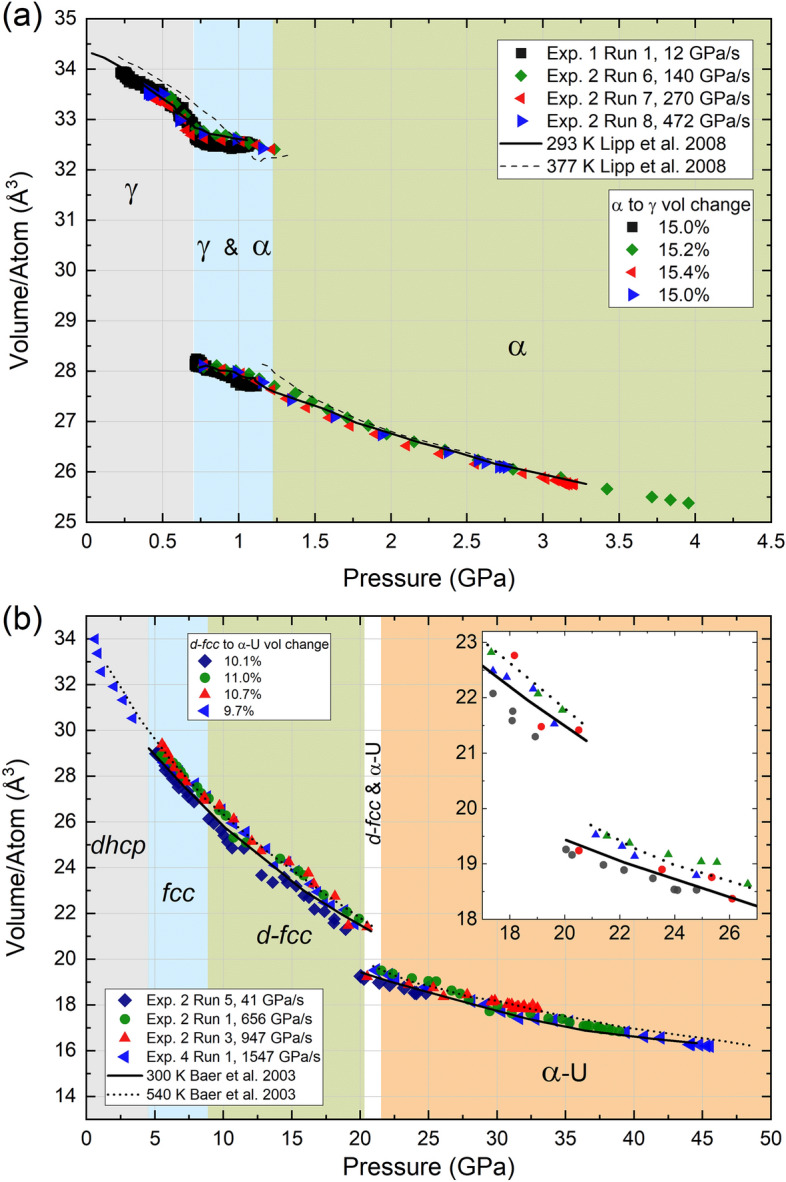
Figure 3.

Representative P–V curves collected at various compression rates for (a) Ce and (b) Pr. Multiple runs at different compression rates are plotted to highlight that there are no systematic changes in the P–V curves collected at different compression rates. Additionally, elevated temperature isotherms are plotted in both panels to assess whether any significant heating of the sample occurs under rapid compression at room temperature in the dDAC.
