
Figure 4.
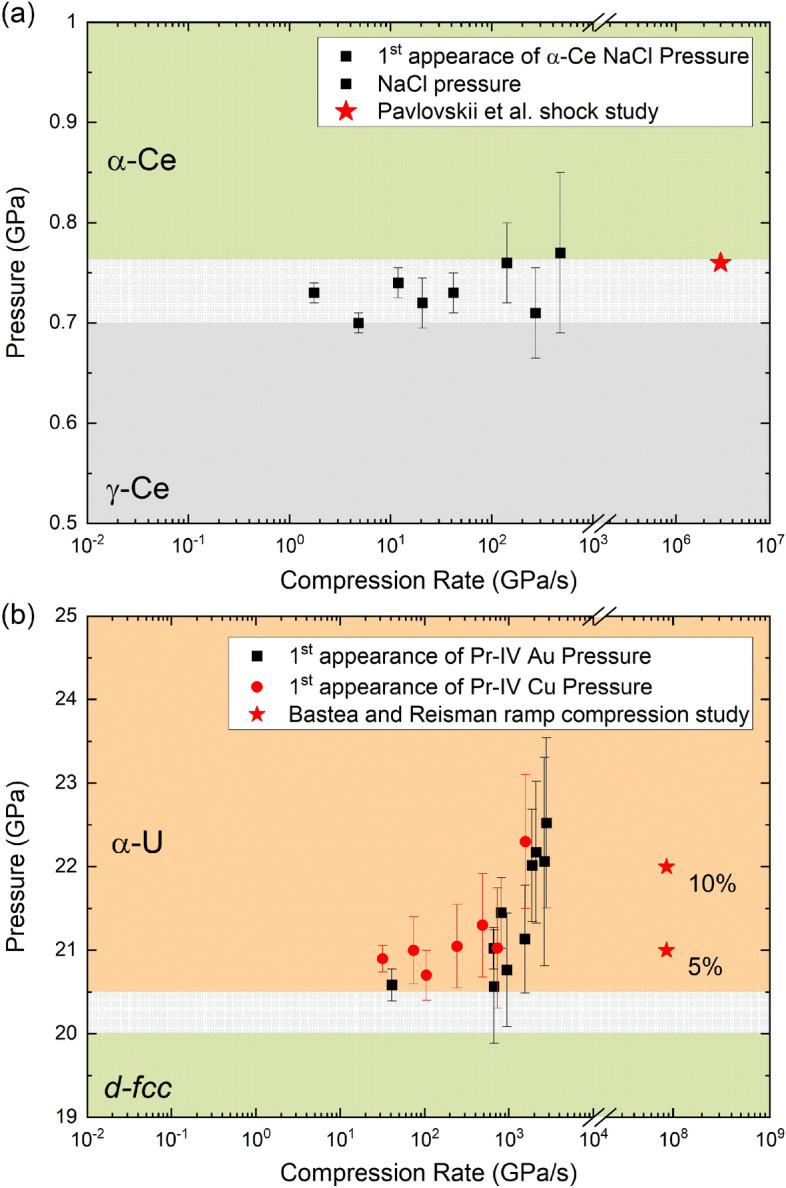
VC transition pressure as a function of compression rate for (a) Ce and (b) Pr. The dotted region is the reported range of the transition pressure as determined from static compression experiments found in the literature20–22,25–27,30,31 (where the compression rates are on the order of 0.01 GPa/s or less). These new dDAC results span nearly 4 orders of magnitude in compression rate and provide a clear picture of how Ce and Pr behave at intermediate timescales.