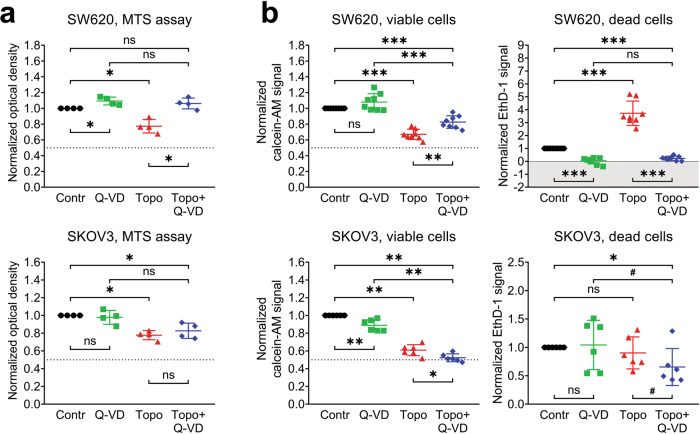
Fig. 3. Cytotoxic and cytostatic effects of topotecan treatment in SW620 and SKOV3 cell lines (microplate-based assays).
The cells were treated with topotecan (20 nM for SW620, 70 nM for SKOV3) in the presence or absence of 25 μM of Q-VD. a Relative optical density values obtained via the MTS assay. The data are normalized to the respective “Contr” samples; the lines and whiskers indicate mean ± standard deviation (N = 4). The dashed lines indicate a 50% reduction in the MTS signal. b Calcein-AM and EthD-1 signals were obtained via the LIVE/DEAD assay. The data are normalized to the respective “Contr” samples; the lines and whiskers indicate mean ± standard deviation (N = 8 for SW620, N = 6 for SKOV3). The dashed lines indicate a 50% reduction in the calcein-AM signal, and the gray area indicates the EthD-1 signal that is below the average background level. “Contr” – control samples; “Topo” – topotecan.

