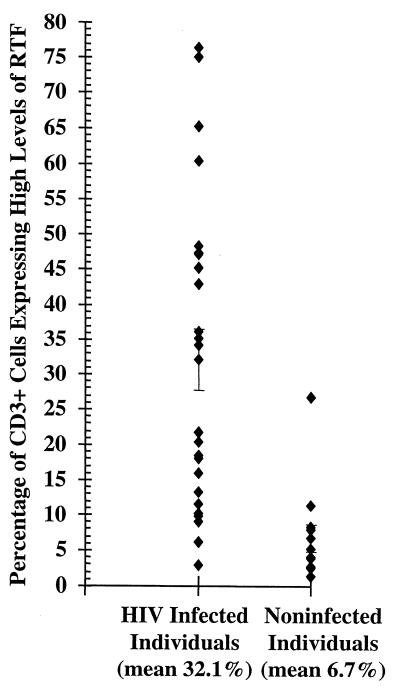
FIG. 3.
Flow cytometric analysis of CD3+ peripheral blood cells expressing high levels of RTF in individuals infected (n = 25) or not infected (n = 13) with HIV. The bars represent standard errors of the means. Mean percentages of high-level RTF expression for each group are indicated under the grouping labels on the x axis.

