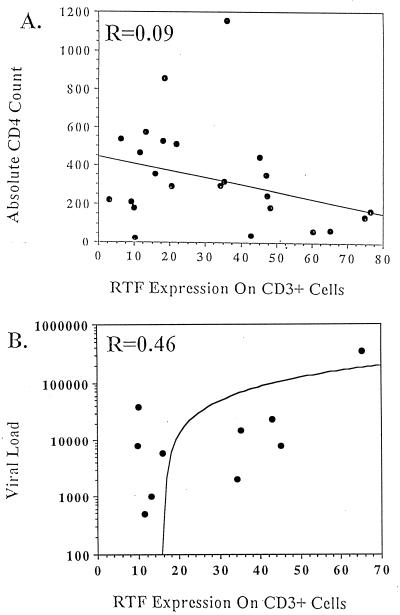
FIG. 5.
Linear regression comparison of high-level RTF expression on CD3+ cells obtained from individuals infected with HIV and either absolute CD4 count (n = 25) (A) or viral load (n = 10) (B). Linear regression coefficients (r values) are indicated in the upper left corner of each linear regression graph. Lines on graphs represent the mathematical best fit for the input data.

