Figure 1.
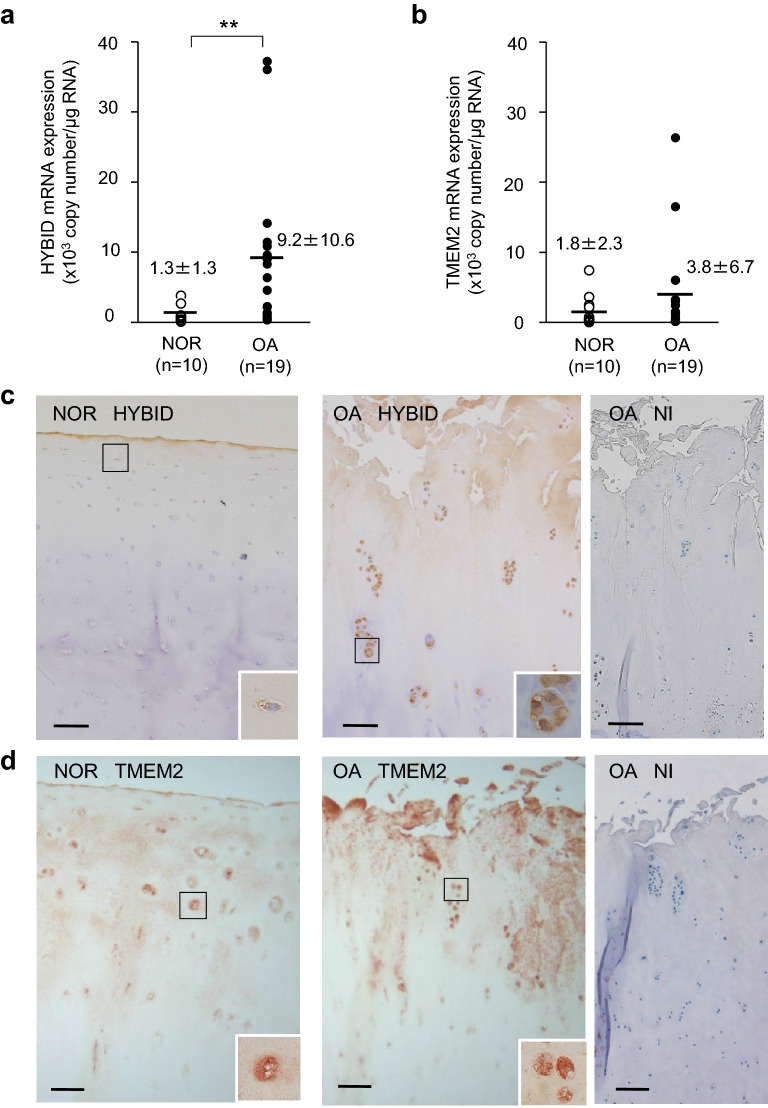
Expression of HYBID and TMEM2 and their tissue localization in human articular cartilage. (a) and (b) Copy numbers of HYBID and TMEM2 transcripts in control normal (NOR) and OA cartilage samples. The copy numbers were determined by quantitative real-time PCR assay with standard curves generated from reference plasmids. Symbols represent individual subjects, and horizontal lines indicate means. **, P < 0.01. (c) and (d) Immunohistochemistry for HYBID and TMEM2 in human cartilage tissue. Paraffin sections of the NOR and OA cartilage samples were stained with anti-HYBID antibody (HYBID), anti-TMEM2 antibody (TMEM2) or non-immune IgG (NI). Boxed areas are shown at higher magnification in the inset. Scale bars = 200 µm. Full-length images for the inset are presented in Supplementary Figure S1b.

