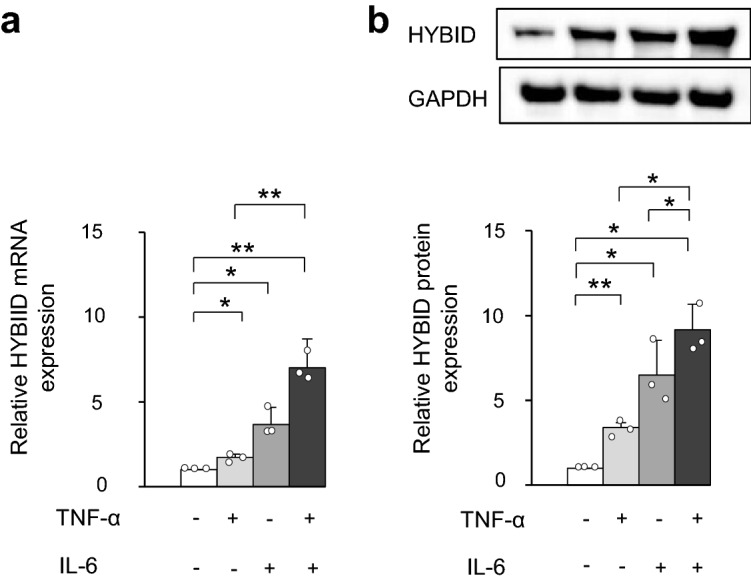
Figure 4.

Additive effect of the HYBID expression by TNF-α and IL-6 in OA chondrocytes. (a) and (b) Effects of TNF-α and IL-6 on the mRNA and protein expression of HYBID in OA chondrocytes, respectively. OA chondrocytes at P2 were treated with TNF-α (0 or 10 ng/ml) and/or IL-6 (0, 100 ng/ml) in the presence of sIL-6R (100 ng/ml) for 24 h and 48 h, and cell lysates were subjected to quantitative real-time PCR for HYBID expression using the ΔΔCt method (a) and immunoblotting with anti-HYBID antibody, followed by densitometric analysis (b). The average HYBID:GAPDH ratio in control OA chondrocytes treated with vehicle was set at 1. Values are expressed mean ± SD (n = 3). *, P < 0.05; **, P < 0.01. The uncropped full-length gels are presented in Supplementary Figure S5.
