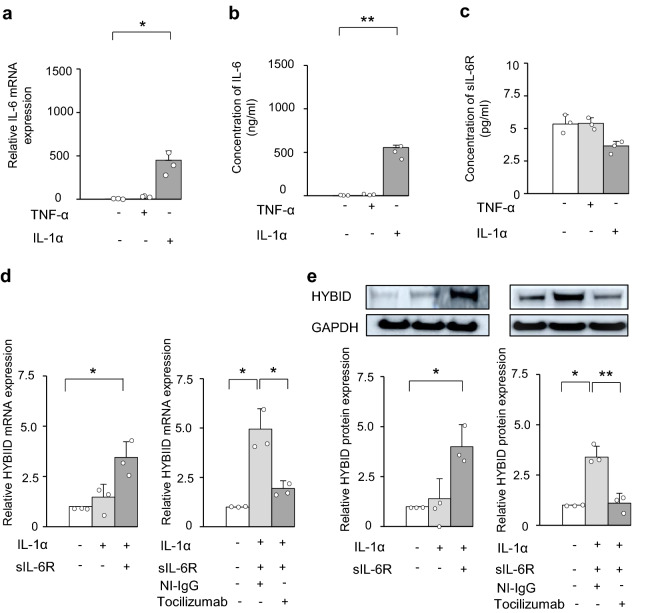
Figure 5.
Expression of IL-6 and sIL-6R in OA chondrocytes treated with TNF-α or IL-1α and involvement of IL-6 in IL-1α-stimulated HYBID overexpression. (a) and (b) Overexpression of IL-6 in OA chondrocytes treated with IL-1α. OA chondrocytes at P2 were treated with TNF-α (0 or 10 ng/ml) or IL-1α (0 or 10 ng/ml) for 24 h, and mRNA isolated from cell lysates was subjected to quantitative real-time PCR for IL-6 using the ΔΔCt method (a). Concentrations of IL-6 produced into culture media by OA chondrocytes treated with TNF-α (0 or 10 ng/ml) or IL-1α (0 or 10 ng/ml) for 48 h were measured by ELISA (b). The average HYBID:GAPDH ratio in control OA chondrocytes treated with vehicle was set at 1. (c) Concentration of sIL-6R in culture media of OA chondrocytes treated with IL-1α or TNF-α. OA chondrocytes were treated with IL-1α (0 or 10 ng/ml) or TNF-α (0 or 10 ng/ml) for 24 h and culture media were subjected to ELISA for sIL-6R. (d) and (e) IL-6-mediated HYBID overexpression in OA chondrocytes stimulated with IL-1α. OA chondrocytes were treated with IL-1α (0 or 10 ng/ml) in the presence or absence of sIL-6R (100 ng/ml) for 24 h and 48 h, and the mRNA and protein expression of HYBID was analyzed by quantitative real-time PCR using the ΔΔCt method (d) and immunoblotting with anti-HYBID antibody (e). To examine the involvement of IL-6 in IL-1α-stimulated HYBID expression, the expression was analyzed by treating the IL-1α (10 ng/ml) and sIL-6R (100 ng/ml)-stimulated chondrocytes with non-immune IgG (NI-IgG, 25 µg/ml) or anti-IL-6R antibody (tocilizumab, 25 µg/ml). Values are expressed mean ± SD (n = 3). *, P < 0.05; **, P < 0.01. The uncropped full-length gels are presented in Supplementary Figure S6.

