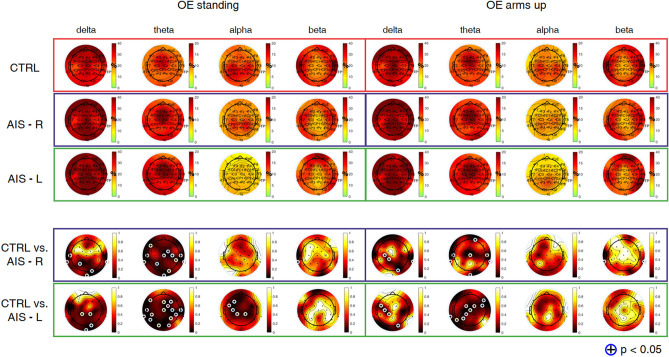
Figure 1.
Topographic maps of relative power (%) in delta [1–4] Hz, theta [4.5–7.5] Hz, alpha [8–12] Hz, and beta [13–30] Hz bands, during OE standing and OE arms up, averaged from 14 controls (CTRL) (first row), 10 adolescents with AIS with right main curve (second row) and 4 adolescents with AIS with left main curve (third row). The fourth and the fifth rows represent p-maps derived from the Wilcoxon rank sum test (adolescents with AIS with right main curve: AIS-R vs. CTRL; adolescents with AIS with left main curve: AIS-L vs. CTRL). Statistical results were highlighted with (+) for .

