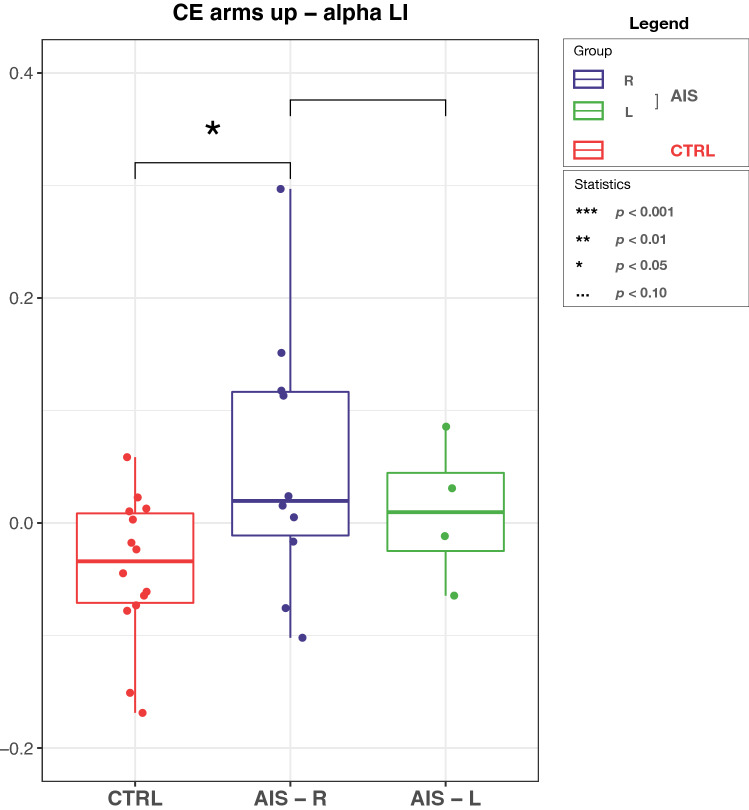
Figure 3.
Grand-average LI in alpha band during CE arms up for controls (CTRL), adolescents with AIS with right main curve (AIS-R) and adolescents with AIS with left main curve (AIS-L). On each box, the central red line indicates the median, and the bottom and top edges of the box indicate the 25th and 75th percentiles, respectively. The whiskers extend to the most extreme data points not considered outliers, and the outliers are plotted individually using the ‘+’ symbol. Significant difference () was observed between CTRL and AIS-R.

