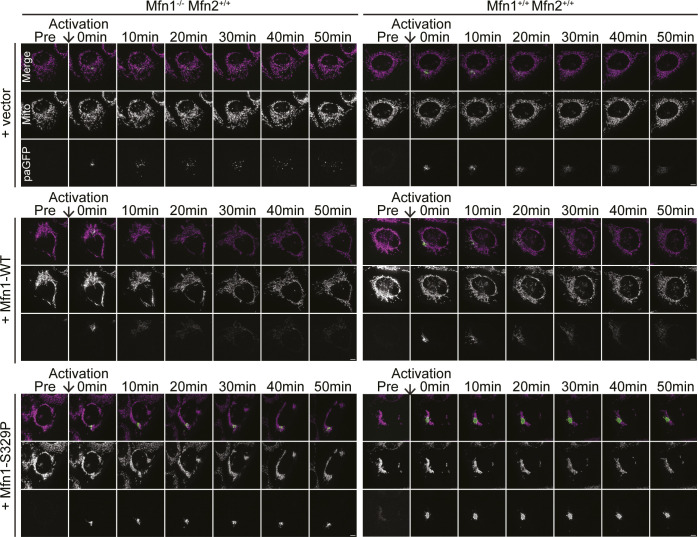
Figure S1. Representative images of mt-paGFP diffusion over 50 min.
Representative images of Mfn1-null or WT MEFs expressing mt-paGFP and transduced with an empty vector (V), Mfn1WT-FLAG, or Mfn1S329P-FLAG before activation of mt-paGFP (Pre) and 0, 10, 20, 30, 40, and 50 min following. Mitochondria were labeled with MitoTracker Red CMXRos and visualized with live-cell fluorescence microscopy. Images represent maximum intensity projections. Scale bar = 5 μm.

