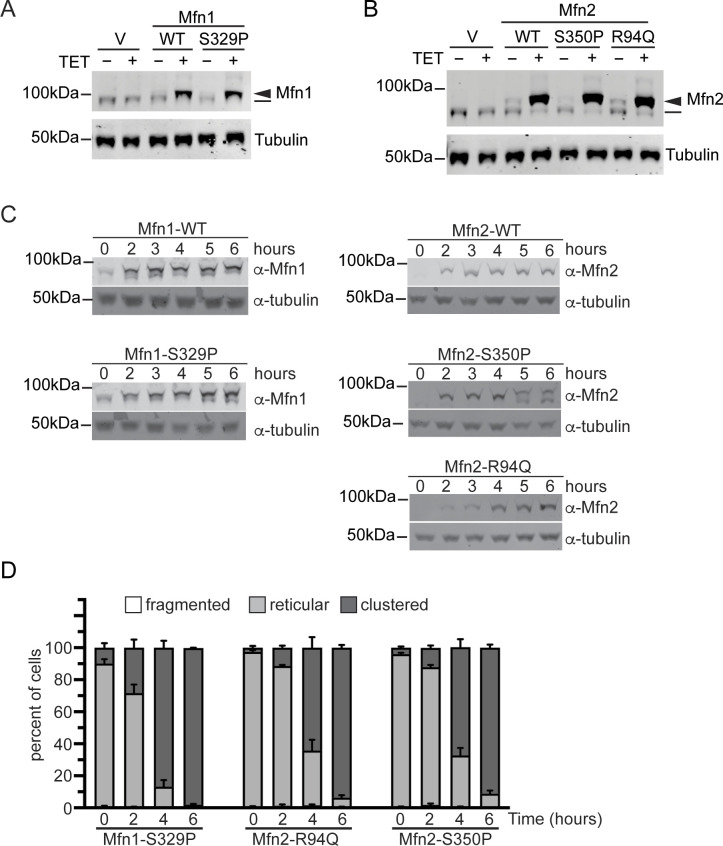
Figure S4. Mitofusin protein expression in Flp-In TREx HEK293 induced with 0.2 μg/ml TET.
(A) Whole-cell lysates prepared from the indicated cell lines incubated in the absence (−) or presence (+) of 0.2 μg/ml TET for 4 h were subject to SDS–PAGE and immunoblotting with α-Mfn1 and α-tubulin. Endogenous Mfn1 and Mfn1-FLAG are indicated with a line an arrowhead, respectively. (B) Whole-cell lysates prepared from the indicated cell lines incubated in the absence (−) or presence (+) of 0.2 μg/ml TET for 4 h were subject to SDS–PAGE and immunoblotting with α-Mfn2 and α-tubulin. Endogenous Mfn2 and Mfn2-FLAG are indicated with a line an arrowhead, respectively. (C) Whole-cell lysates prepared from the indicated cell lines incubated in the absence (−) or presence (+) of 0.2 μg/ml TET for the indicated time were subject to SDS–PAGE and immunoblotting with α-Mfn1 or α-Mfn2 and α-tubulin. (C, D) Quantification of the mitochondrial morphology in the cell lines described in (C). Error bars represent mean ± SEM from n = 3 separate blinded experiments (>100 cells per experiment).

