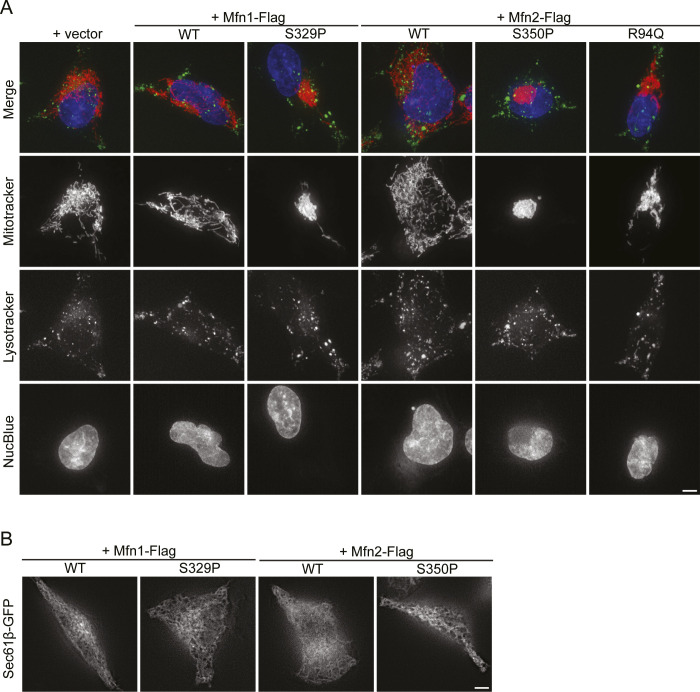
Figure S5. Distribution of lysosome and endoplasmic reticulum are not affected by expression of mitofusin proline variants.
(A) Representative images of Flp-In TREx HEK293 expressing the indicated mitofusin variant after incubation with 0.2 μg/ml TET for 4 h. Mitochondria were labeled with MitoTracker Red CMXRos, lysosomes were labeled with LysoTracker, and nuclei were labeled with NucBlue and visualized by live-cell fluorescence microscopy. Images represent maximum intensity projections. Scale bar = 5 μm. (B) Representative images of Flp-In TREx HEK293 expressing the indicated mitofusin variant after induction of expression by incubation with 0.2 μg/ml TET for 4 h. Endoplasmic reticulum was labeled by expression of Sec61-eGFP and visualized by live-cell fluorescence microscopy. Images represent single z-slices near the coverslip. Scale bar = 5 μm.

