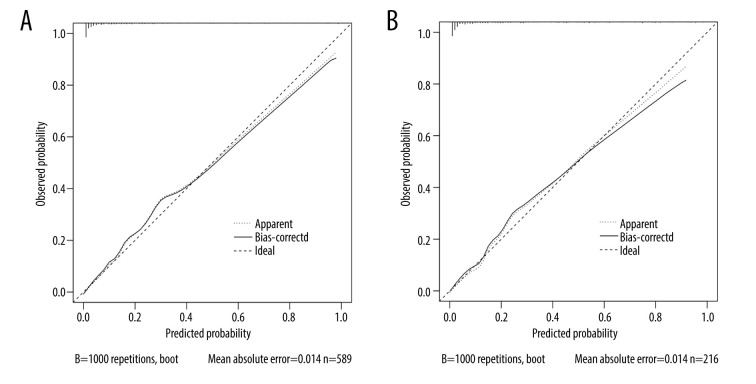
Figure 3.
(A) Calibration curve for risk of sarcopenia in patients on maintenance dialysis (MHD) in the training set. The X-axis represents the predicted probability, and the Y-axis represents the actual probability. The degree of fit of the curve and diagonal reflects the calibration of the model. (B) Calibration curve for risk of sarcopenia in MHD patients in the validation set. The X-axis represents the predicted probability, and the Y-axis represents the actual probability. The degree of fit of the curve and diagonal reflects the calibration of the model.

