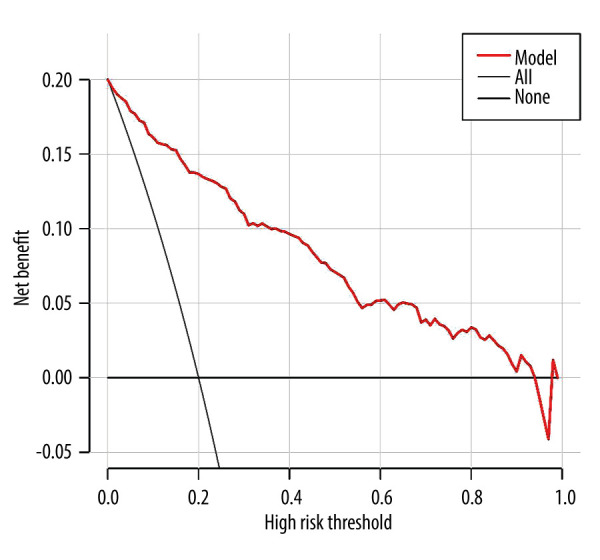
Figure 4.

The decision curve analysis (DCA) curve of prediction model for predicting the risk of sarcopenia in patients on maintenance hemodialysis (MHD). The X-axis represents the threshold probability, and the Y-axis represents the net benefit rate. Horizontal lines indicate that all samples were negative and untreated, with a net benefit of 0. The slope line indicates that all samples were positive and all received intervention, and the slope of the net benefit is the reverse slope line of the negative value.
