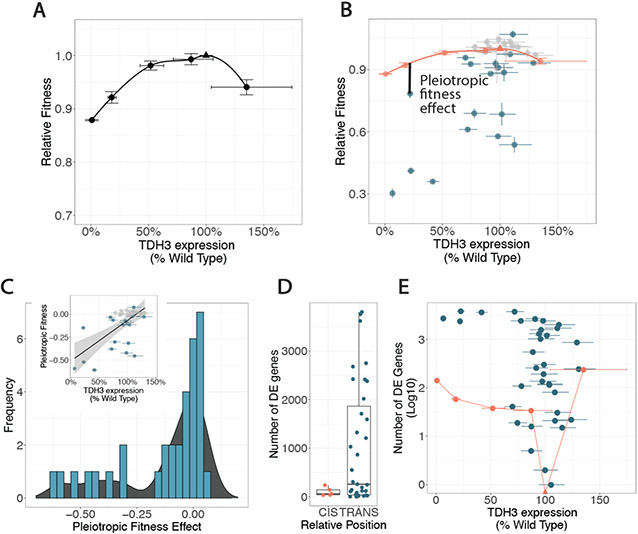
Fig. 2. Pleiotropic effects of trans-regulatory mutations on fitness and gene expression.
(A) Relative fitness is shown for cis-regulatory mutants and a wild-type strain (triangle) with different levels of TDH3 expression. Line fitted with a local polynomial regression (LOESS). (B) Relative fitness and TDH3 expression of trans-regulatory mutants is shown, with the cis-regulatory mutants and fitted LOESS curve from (A) in orange. Pleiotropic fitness effect of one trans-regulatory mutant indicated with solid black line. Mutants with significant pleiotropic fitness effects are blue, not significant are grey. (C) Histogram summarizes pleiotropic fitness effects of all trans-regulatory mutants. A smoothed density distribution derived from this histogram is underlaid in black. Inset shows the same pleiotropic fitness effects plotted vs the effect on TDH3 expression including a robust linear regression (black line). Grey shaded area is the 95% confidence interval. (D) Number of significantly differentially expressed (DE) genes at a 10% FDR is shown for cis-regulatory mutants (orange) and trans-regulatory mutants (blue). Boxplots show median and quartile values. (E) The log10 number of significantly differentially expressed genes at a 10% FDR is shown for each mutant, plotted according to the mutant’s impact on TDH3 expression. cis-regulatory mutants (circles) and wild type strain (triangle) are connected by straight line segments. In all panels, error bars represent one standard error of the mean.

