

Abstract
Protein-protein interactions are critically important for cellular functions, including regulation of ion channels. Ion channels are typically part of large macromolecular complexes that impact their function. These complexes have traditionally been elucidated via standard biochemical techniques including immunoprecipitation, pull-down assays and mass spectrometry. Recently, several methods have been developed to provide a more complete depiction of the microenvironment or “neighborhood” of proteins of interest. These new methods, which fall broadly under the category of proximity-dependent labeling techniques, aim to overcome the limitations imposed by antibody-based techniques and mass spectrometry. In this chapter, we describe the use of proximity labeling to elucidate the cardiac CaV1.2 macromolecular complex under basal conditions and after β-adrenergic stimulation. Using these methodologies, we have identified the mechanism underlying adrenergic stimulation of the Ca2+ current in the heart.
1. Introduction
There has long been a desire for better techniques to understand the spatial organization and dynamic temporal remodeling of protein interaction networks within the cell. Traditional tools for such investigation—antibody-based detection techniques and mass-spectrometry (MS)—have either excluded or included too many candidates to adequately define critical protein interactions (Iacobucci, Monaco, Cozzolino, & Monti, 2021). As such, they have limited our ability to grasp the “what,” “where,” and “when” underlying molecular cell biology. More specifically, antibody-based techniques provide high-quality spatiotemporal information in living cells, but are limited in that they can only identify candidates with high-quality antibodies. While techniques have been developed to genetically recombine targets with antigen-tags to facilitate immune-detection, such methods are cumbersome and labor intensive. MS is similarly limited since even though we can apply this approach to detect thousands of endogenous proteins simultaneously, samples require lysis and therefore provide poor resolution of cellular ultrastructure, particularly for membrane-bound proteins. Further, co-immunoprecipitation and pull-down assays do not adequately capture transient protein-protein interactions, although crosslinking can stabilize some of these interactions (Agou & Veron, 2015). The presence of false positives is also a significant problem using these methodologies, and two databases, the Contaminant Repository for Affinity Purification (CRAPome) (Mellacheruvu et al., 2013) and Significance Analysis of INTeractome (SAINT) (Choi et al., 2012) have cataloged many putative potential false positives.
More recently, several methods have been developed to provide a more complete depiction of the microenvironment or “neighborhood” of proteins of interest (Martell et al., 2012; Roux, Kim, Raida, & Burke, 2012). These new methods, which fall broadly under the category of proximity-dependent labeling techniques, aim to overcome the limitations imposed by antibody-based techniques and MS. The use of BioID and Ascorbate Peroxidase (APEX2) have led to several important insights. BioID imparts proximity-labeling via biotinylation of proteins adjacent to a BirA*-fusion protein in a relatively natural cellular environment (Roux et al., 2012). The biotinylation reaction is initiated by the addition of biotin; biotinylation occurs on lysine side chains within ~10 nm range. Following the labeling reaction, the biotinylated proteins are affinity purified on avidin/streptavidin/neutravidin Sepharose beads, which can be extensively washed in denaturing conditions. One of the principal advantages of proximity-labeling techniques is that cells can be lysed after biotin-labeling using denaturing detergents, enabling the investigation of membrane-bound protein complexes. As with other non-biased discovery-based studies, false positives may be found due to random collisions, which can be ameliorated by fusing BirA* to other components of the target protein complex, or using two interacting proteins each fused to a split-BirA*.
While the original BioID is too slow to capture many of the dynamic processes of interest in cell biology, recent advances in the technique are allowing for the capture of proteins only transiently associated to the target locus (Branon et al., 2018). For BirA*, the biotinylated step requires 18–24 h to achieve sufficient yield, making it somewhat cumbersome to perform some experiments. Using yeast display-based directed evolution, Ting and colleagues engineered two mutants of biotin ligase, TurboID and miniTurbo, which can catalyze proximity labeling with greater efficiency than BioID or BioID2—within ~10 min upon biotin addition (Branon et al., 2018).
Heme peroxidases have been used for many laboratory applications—for example, horseradish peroxidase (HRP) is used for Western blots and enzyme-linked immunosorbent assays (ELISA). Ting and colleagues engineered APEX, which compared to HRP lacks disulfides, enabling it to be expressed and function in the reducing environment of cells (Martell et al., 2012). In live cells treated with biotin-phenol and H2O2, biotin-phenol is oxidized to a short-lived (<1 ms) biotin-phenoxyl radical, that covalently binds to exposed electron-rich amino acids such as tyrosine, tryptophan, histidine and cysteine. Compared to BioID and TurboID, APEX2 catalyzed-labeling functions similarly to BioID, with similar resolution (~20 nm) but requires very short (~1 min) reaction times (Rhee et al., 2013). The speed of APEX2-mediated labeling has allowed for the simultaneous study of (1) the composition of a protein network (2) its organization in space and (3) its evolution over time during dynamic processes such as ligand-receptor binding (Lam et al., 2015). APEX2 labeling to G-protein coupled receptors (GPCRs), for example, provided a powerful new platform for quantitative analysis of GPCR signaling, allowing parallel time-resolved measurement of hundreds to thousands of protein-protein interactions and thereby revealing new aspects of GPCR signaling biology (Lobingier et al., 2017; Paek et al., 2017). Work on APEX2-conjugated GPCR functioned as a proof of concept showing that it was possible to identify signal transduction components via target-APEX2 fusion even in the absence of prior knowledge in signaling effectors.
CaV1.2-APEX2 fusion has similarly been successful in elucidating previously unknown effectors in β-adrenergic augmentation of the CaV1.2 channel (Liu et al., 2020). Briefly, our protocol involved (1) confirmation of normal trafficking and function of the CaV1.2-APEX2 fusion protein; (2) validation of APEX2 labeling via detection of known interactors; (3) isolation of APEX2 labeled proteins via streptavidin-pulldown; and (4) identification of isolated proteins via quantitative MS. In our protocol, APEX2-mediated labeling was performed on isolated adult cardiomyocytes and Langendorff-perfused hearts treated with and without the β-agonist, isoproterenol. Through our experimentation we identified the Ca2+ channel inhibitor Rad as a key mediator in β-adrenergic stimulation of cardiac CaV1.2 channels (Fig. 1).
Fig. 1.
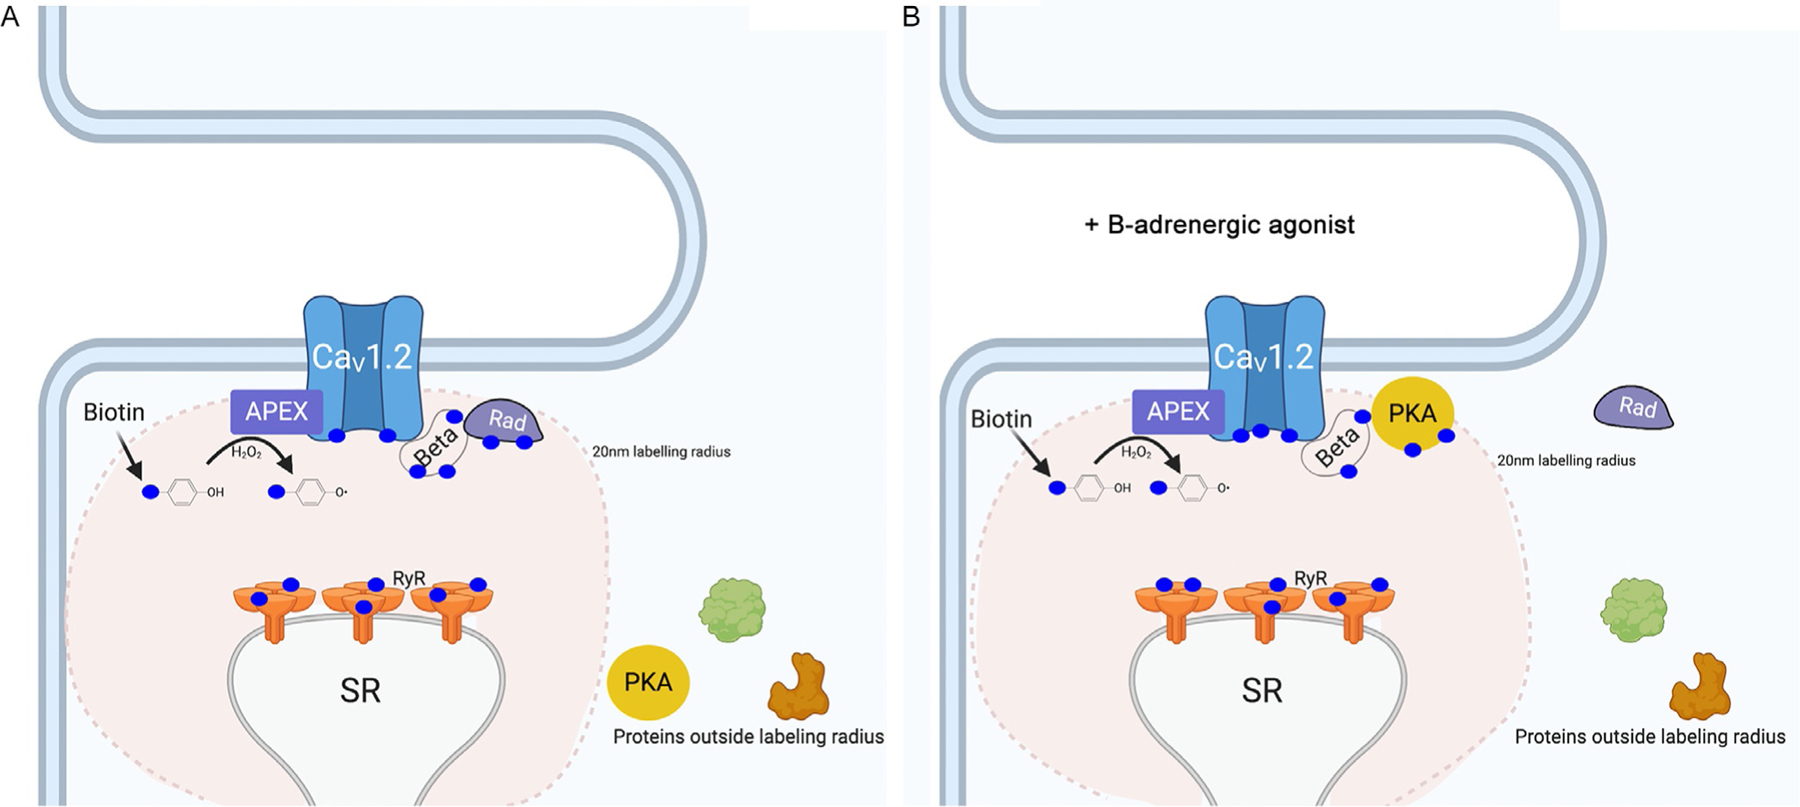
(A) Schematic showing principle of using transgenic mice expressing APEX2 fused to CaV1.2 α1C- or β2B-subunits in the heart to probe proteins within a ~20 nm radius by labeling them with biotin. Under basal conditions, among the proteins found in the CaV1.2 nanodomain using this proximity labeling approach is Rad, a Ras-like GTP-binding protein that inhibits CaV1.2 channels. (B) β-Adrenergic stimulation significantly reduces Rad in CaV1.2 nanodomain, implicating it as a potential transducer of adrenergic signaling in the heart, which was subsequently confirmed.
More broadly, APEX2-mediated labeling represents an exciting method for continued probing into the microenvironments of ion channels, advancing the discovery of key mediators in ion channel function.
2. Generation of APEX2-CaV1.2 mice
2.1. Cloning and construct design considerations
To increase the likelihood of detecting an unrecognized protein transducer underlying adrenergic modulation of CaV1.2, we characterized the micro-domains of both the α1C and β2B subunits. Because cleavage of the α1C C-terminus is thought to play a role in channel trafficking and regulation, we spliced commercially gene-synthesized V5-APEX2 cDNA (Hung et al., 2014; Lam et al., 2015) into the intracellular N-terminus of a cardiac rabbit α1C cDNA construct (accession number X15539) that has been mutated to render it resistant to dihydropyridine Ca2+-channel blockers (T1066Y and Q1070M) (He, Bodi, Mikala, & Schwartz, 1997; Hockerman, Johnson, Abbott, Scheuer, & Catterall, 1997). This allows us to distinguish transgenic currents from native currents and to confirm their adrenergic responsiveness in cardiac myocytes (Fig. 2A). The absence of tyrosine residues in V5 makes it unlikely to become biotinylated, eliminating the potential to disrupt antibody detection during validation. Similarly, V5-APEX2 was spliced into the N-terminus of human β2B cDNA (accession AAG01473).
Fig. 2.
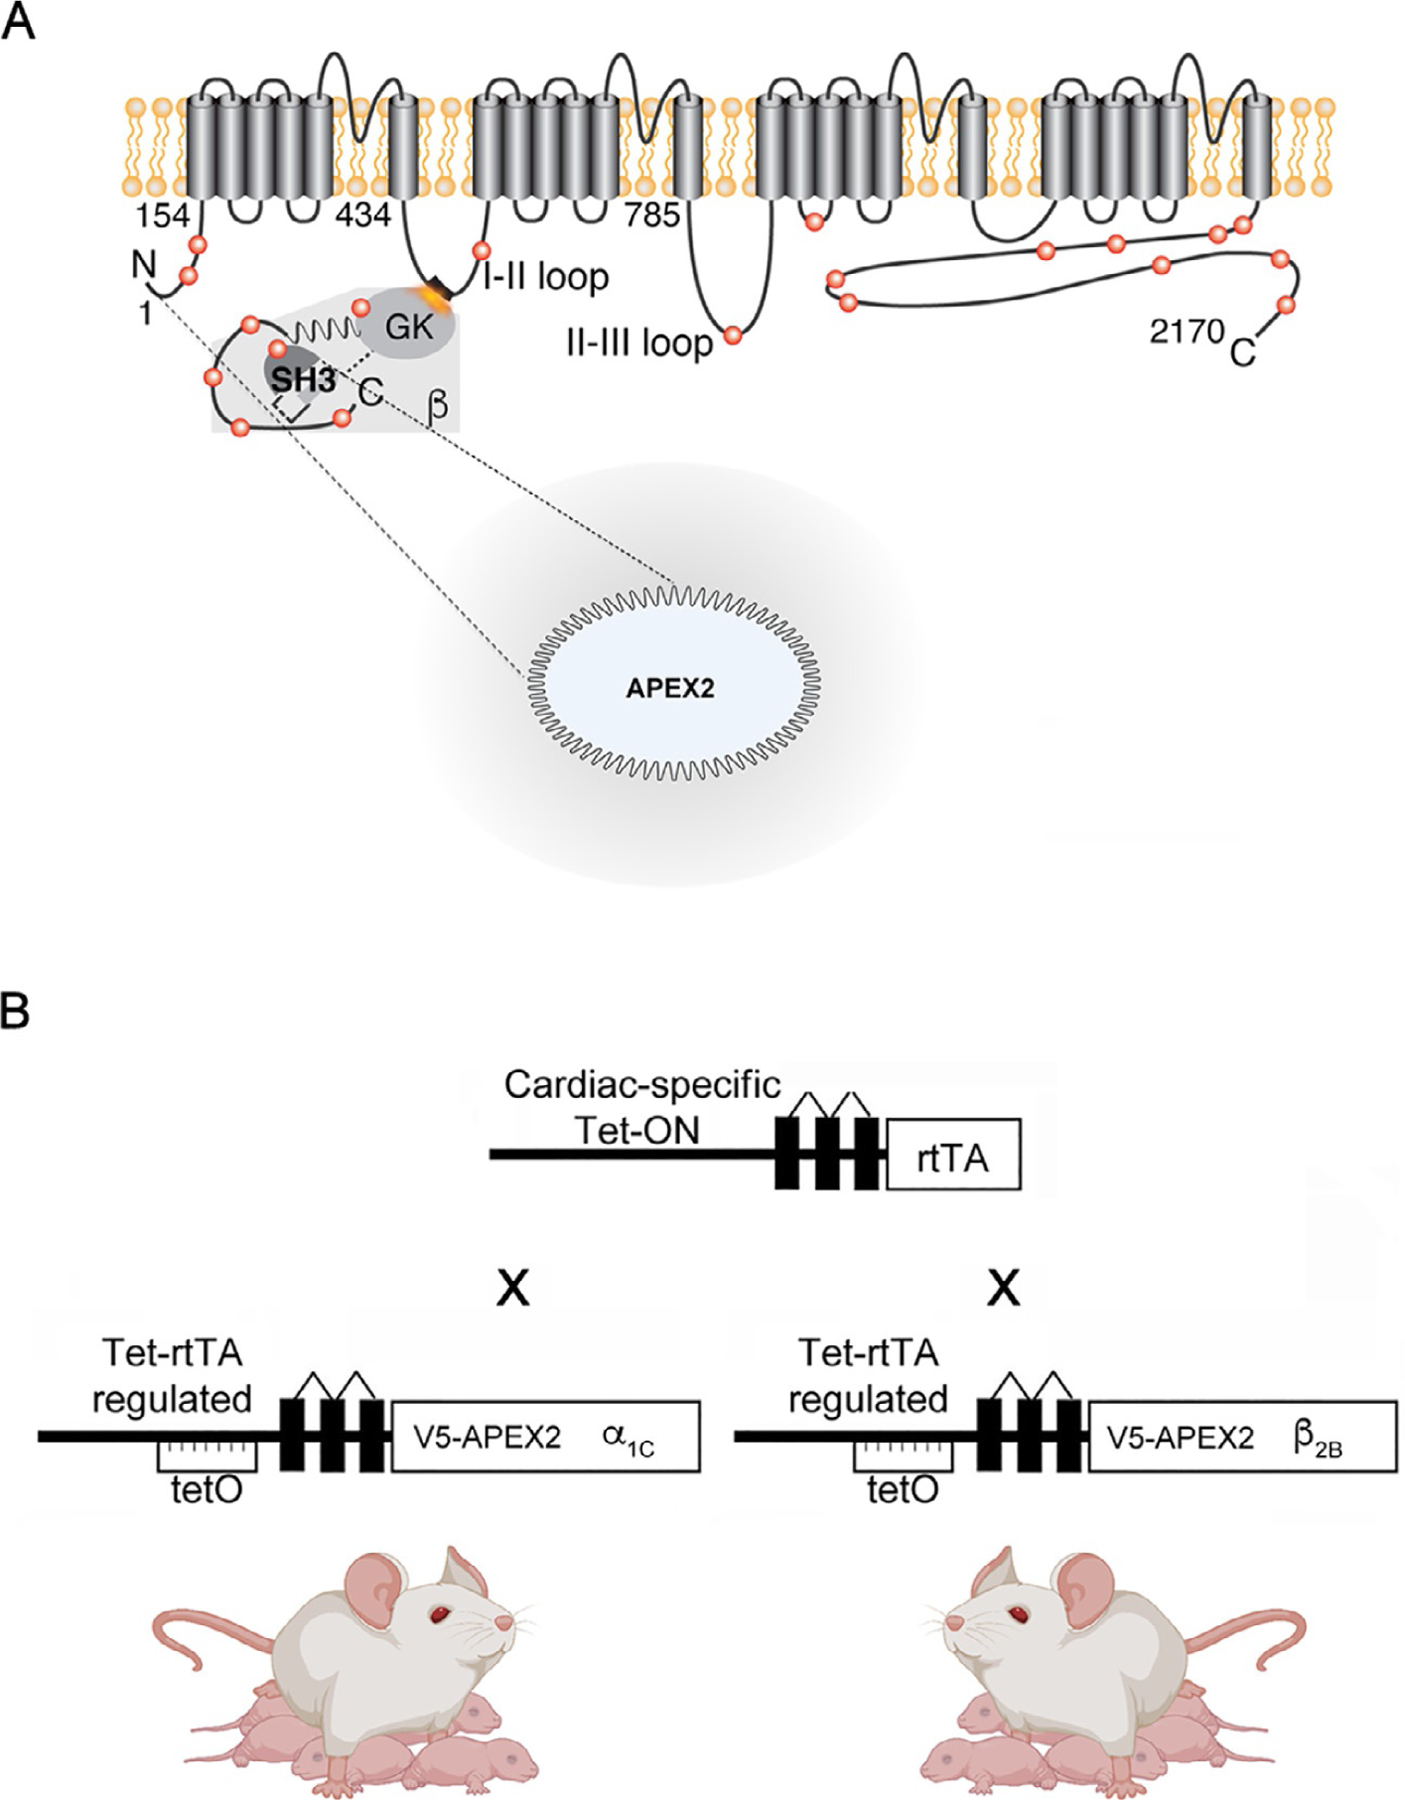
(A) APEX2 was gene-synthesized downstream of a V5 epitope and cloned into the intracellular N-terminus of CaV1.2 α1C- and β2B-subunits. α1C, the CaV1.2 pore-forming subunit contains four domains and multiple intracellular regulatory regions including the I-II domain linker, where β2B-subunits bind with nanomolar affinity. (B) Cardiac-specific expression of APEX2-fused channel subunits was accomplished by mating mice with cardiac reverse transcriptional transactivator (rtTA) expression (driven by the cardiac specific α-MHC promoter) to α1C- and β2B-APEX2 transgenic mice and feeding the progeny doxycycline-impregnated chow. Transcription of transgenic channels, regulated by a Tet-ON promoter, requires a tetracycline antibiotic and rtTA. Created in part with Biorender.com.
2.2. In vitro biochemical validation of APEX2 channel fusion proteins
Clone α1C- and β2B-APEX2 into a mammalian expression vector such as pcDNA3.1.
Seed HEK cells on 60 mm dishes in DMEM with 10% fetal bovine serum (FBS) to achieve 50%–75% confluence the following day.
Transfect two dishes of HEK cells with 6 μg α1C-APEX2 and 6 μg wild-type human β2B cDNA prepared in OptiMEM with Lipofectamine 2000. Transfect two dishes with 6 μg β2B-APEX2 and 6 μg wild-type rabbit α1C. Transfect one dish with wild-type rabbit α1C and human β2B.
The following day wash all dishes 3 × with phosphate-buffered saline (PBS).
Incubate cells in all dishes with 500 μM biotin-tyramide (also known as biotin-phenol, Iris-biotech) (500 mM stock prepared in DMSO and stored at −80 °C) in PBS for 30 min.
On the lab bench, treat the dish of wild-type CaV1.2 subunit-transfected cells, one dish of α1C-APEX2 and one dish of β2B-APEX2 transfected cells with 1 mM H2O2 (final concentration) for 1 min.
Wash the cells in pre-prepared ice-cold quenching buffer—PBS containing 5 mM Trolox (Sigma 238813), 10 mM sodium ascorbate (VWR 95035–692), and 10 mM sodium azide (Sigma S2002) precisely 1 min after addition of H2O2. Wash cells two additional times in quenching buffer. Note: sodium ascorbate must be prepared fresh immediately before the experiment.
Remove cells from all dishes by aggressive pipetting, pellet for 5 min at 200 × g, resuspend and vortex in ice cold lysis buffer containing: 50 mM Tris (tris(hydroxymethyl)aminomethane), 150 mM NaCl, 10 mM EGTA, 10 mM EDTA, 1% Triton X-100 (v/v), 0.1% SDS (w/v), 10 mM sodium ascorbate, 5 mM Trolox, 10 mM sodium azide, phosphatase inhibitors (Sigma 4906845001), protease inhibitors (Sigma 4693159001), calpain inhibitor I (Sigma A6185) and calpain inhibitor II (Sigma A6060).
Pellet cell membranes and other debris at 21,130 × g at 4 °C and collect lysates.
Denature and resolve lysates on a gradient denaturing gel and transfer to nitrocellulose.
Blot the membrane with streptavidin-conjugated to HRP (Thermofisher, S911) to determine the labeling activity of the APEX2 fusion protein. If successful, ladders of chemiluminescent bands of many sizes should be visible in those lanes with protein from APEX2-transfected cells that were also treated with H2O2.
Wash 375 μL streptavidin beads (Pierce) in lysis buffer using a magnetic tube rack—75 μL of beads for each dish of cells. Incubate a volume of lysate containing 1 mg protein with 75 μL beads, nutating at 4 °C overnight.
Remove the supernatant and wash the beads in fresh lysis buffer with nutation for 10 min. Repeat two more times. Elute biotinylated proteins from beads at 95 °C for 5 min in a denaturing gel-loading buffer. Resolve bead-eluates on protein gels alongside input lysate, and transfer to nitrocellulose before immunoblotting for the APEX2-fused protein of interest, as well as known interactors.
2.3. In vitro functional validation of APEX2 channel fusion proteins
Day 0
-
1
In DMEM with 10% FBS seed HEK cells in three 35 mm dishes to achieve a density of 50%–75% the following day
Day 1
-
2
Transfect one dish with 3 μg α1C-APEX2 in pcDNA as well as 3 μg wild-type human β2B (necessary for trafficking of α1C subunits (Yang et al., 2019)) and 0.5 μg GFP with 9 μL of lipofectamine per dish. Other dishes are transfected with β2B-APEX2, wild-type α1C, and GFP, and both wild-type α1C, β2B and GFP.
-
3
4–6 h after transfection, replace media with DMEM and 10% FBS.
-
4
Place 10–15 10 mm autoclaved or sterile glass coverslips in three 60 mm dishes and incubate overnight at 37 °C in Attachment Factor (Gibco).
Day 2
-
5
Confirm success of transfection by visualizing GFP-fluorescence.
-
6
Wash attachment factor from 60 mm dishes. Mechanically dissociate transfected cells with aggressive pipetting until a single-cell suspension is achieved and re-plate in 60 mm dishes to achieve 10% density the following day.
Day 3
-
7
Confirm the membrane-insertion and function of APEX2-CaV1.2 subunits electrophysiologically with patch clamp of green cells in the whole-cell configuration, using Ba2+ as a charge carrier, and a ramp protocol (−60 mV to +60 mV, 200 ms every 10 s) (Liu et al., 2020).
2.4. Generation and breeding of transgenic cardiac inducible APEX2-CaV1.2 mice
α1C- and β2B-APEX2 constructs are cloned into an expression plasmid downstream of a tetracycline-inducible modified murine α-myosin heavy chain (MHC) vector (Hambleton et al., 2007; Sanbe et al., 2003). Transgenic mice are generated with pronuclear injection of the linearized and purified DNA (Fig. 2B).
The mice are mated to mice with transgenic expression of codon-optimized reverse tetracycline transactivator (rtTA) driven by the cardiac specific α-MHC promoter. Expression of the transgene can be induced with doxycycline.
3. Validation of APEX2-CaV1.2 mice
To realize the true promise of APEX2 proximity labeling, first, one must confirm the correct localization of APEX2 fusion proteins at the time of labeling—for our experiments using CaV1.2-APEX, this would be in the mature adult cardiac myocyte. Voltage-activated cardiac Ca2+ channels must localize to the cardiac dyad to initiate excitation-contraction (E-C) coupling. Additionally, as our goal was to use these transgenic CaV1.2-APEX2 mice to probe changes to the channel interactome during β-adrenergic stimulation, we also had to confirm that these transgenic channels are upregulated by this signal transduction pathway.
3.1. Confirming α1C-APEX2 channel function and localization in intact myocytes through E-C coupling
Coat 10 mm square glass coverslips in PBS with laminin (Invitrogen) at a concentration of 1 mg/mL for 1 h at 37 °C.
In accordance with institutional IACUC protocols, isolate cardiomyocytes from 8- to 12-week old transgenic double positive CaV1.2-APEX2 × rtTA mice (henceforth referred to simply as α1C-APEX2 or β2B-APEX2 mice). For the sake of brevity, refer to our prior work and published protocols for myocyte isolation (Liu et al., 2020; Yang et al., 2019, 2013). Allow cells to settle and wash once with fresh isolation buffer.
A small fraction of isolated cells are subjected to increasing concentrations of Ca2+ in myocyte isolation buffer in 10-min intervals, up to 450 μM.
Allow myocytes to settle on glass coverslips for 30 min.
Place a coverslip in the perfusion chamber on an inverted microscope equipped with the IonOptix Ca2+ and Contractility System and superfuse with Tyrodes buffer with 1 mM Ca2+ containing 300 nM nisoldipine, to inhibit the native CaV1.2, but not the dihydropyridine-resistant α1C-APEX2 channels. Pace cells at 60-Hz with 0.5 ms pulses at the minimum voltage necessary to detect myocyte contraction. Note: we do not use Ca2+-fluorophores in these studies because UV light hydrolyzes dihydropyridine Ca2+ channel blockers. If contractions are detected, localization of CaV1.2 to the transverse tubule is likely, given the reliance of cardiac excitation-contraction coupling on intact Ca2+-induced Ca2+ release initiated by CaV1.2 at dyadic junctions (Fig. 3A).
Select healthy-appearing, rectangular myocytes with sarcomere length at least 1.75 μm to study. Record at least 1 min of baseline contractions and then superfuse 200 nM isoproterenol with 300 nM nisoldipine. Increases in myocyte contractility in the presence of isoproterenol (and nisoldipine) demonstrate that APEX2-fused channels are regulated by adrenergic signaling.
Fig. 3.
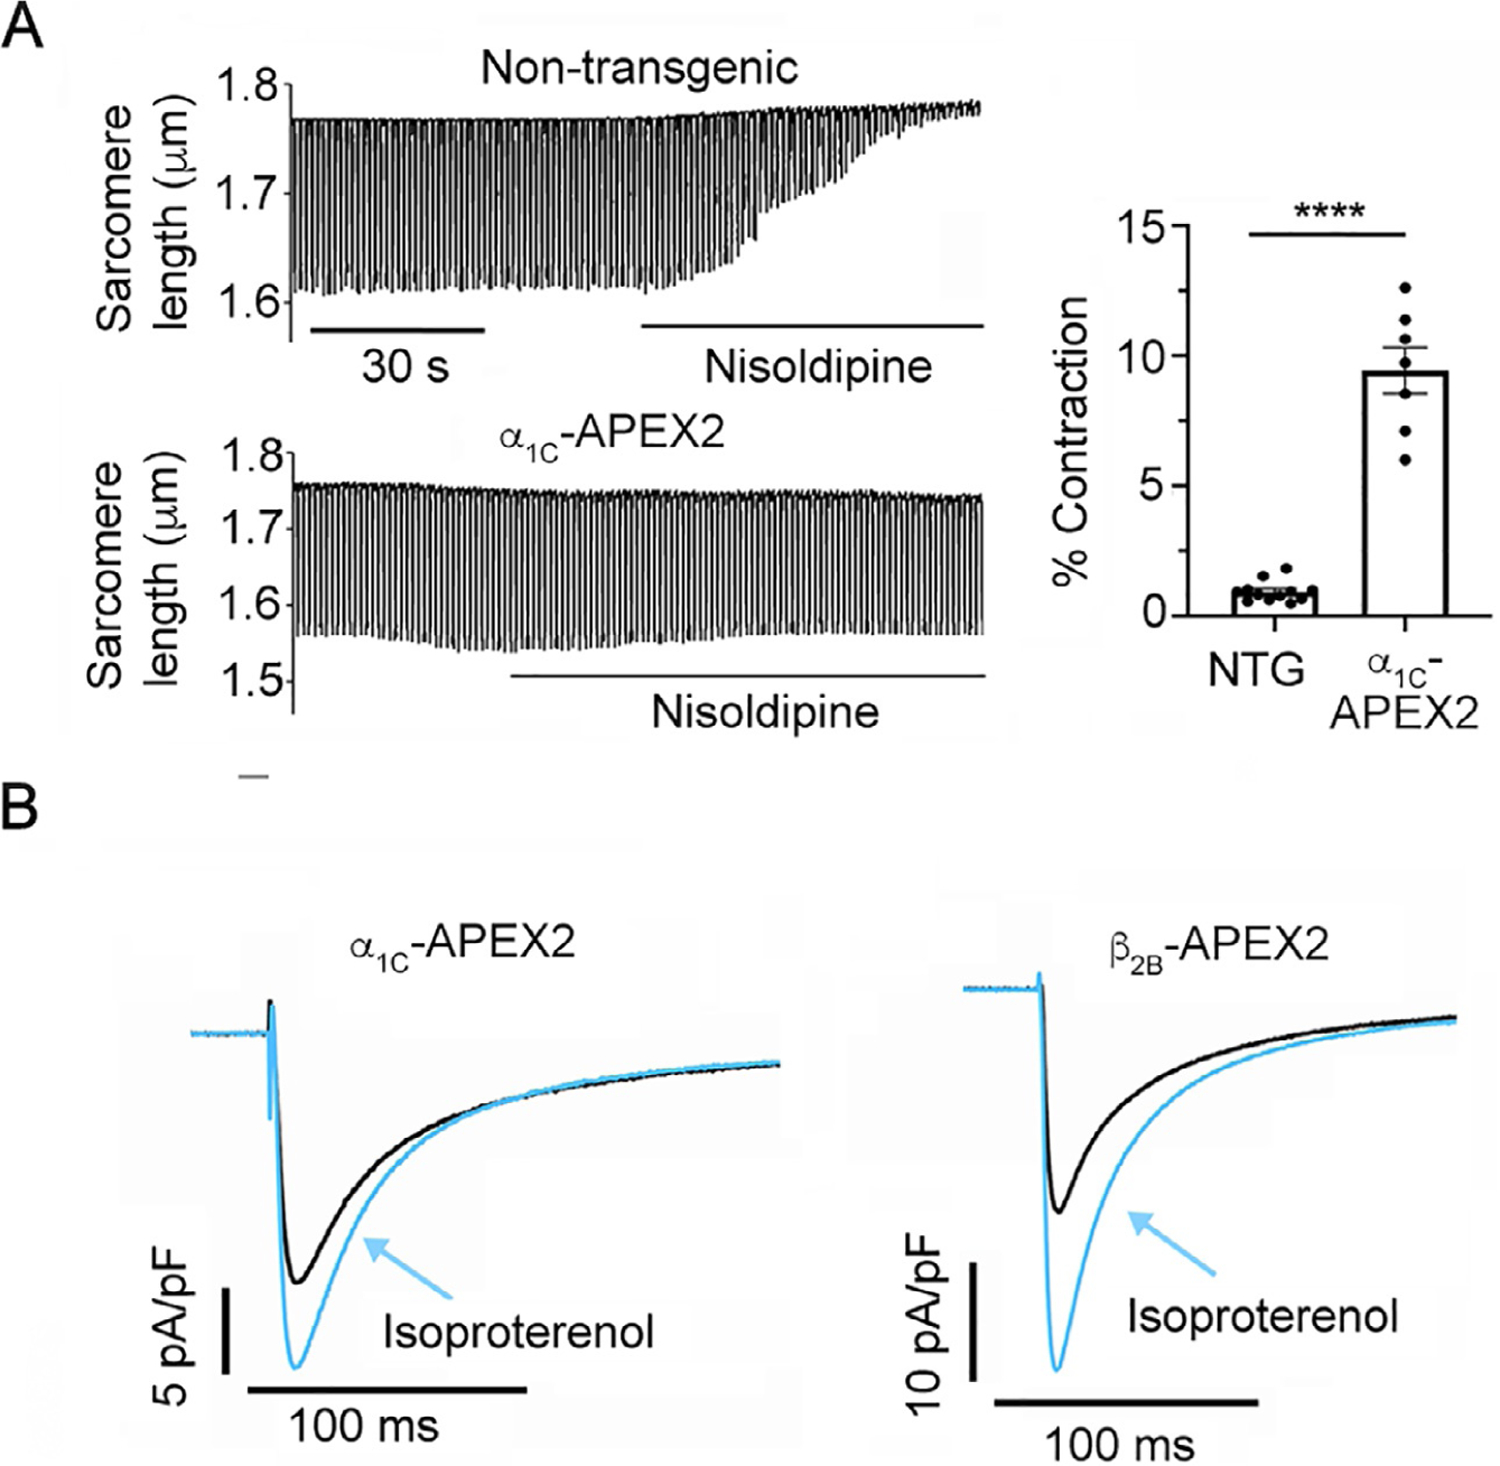
(A) Changes in sarcomere length in isolated nontransgenic (NTG) C57BL/6 and transgenic α1C-APEX2 myocytes were recorded using the Ionoptix Contractility System during electrical field stimulation at 1 Hz in 1 mM Ca2+ with and without 200 nM nisoldipine. α1C-APEX2 in transgenic mice is expressed and traffics to T-tubules in ventricular myocytes, evidenced by intact, nisoldipine-resistant E-C coupling. NTG mouse α1C lacks the two point mutations that confer nisoldipine resistance to the transgenic mice. (B) Representative recordings of whole-cell CaV1.2 currents in myocytes isolated from transgenic APEX2-CaV1.2 mice. α1C-APEX2 myocytes were exposed to 300 nM nisoldipine in addition to 200 nM isoproterenol.
3.2. Confirming APEX2-CaV1.2 channel function and regulation in intact myocytes with patch clamp
Similar to E-C coupling experiments, myocytes should be isolated from 8 to 12 weeks old α1C- and β2B-APEX2 mice.
Using whole-cell configuration and Ca2+ as a charge carrier, record myocyte Ca2+ currents during voltage steps from −40 to +60 mV from a holding potential of −50 mV without and, for α1C-APEX2 mice, with superfusion of 300 nM nisoldipine. Note β2B-APEX2 mice do not have dihydropyridine-resistant Ca2+ currents.
Repeat this step protocol now with 200 nm isoproterenol on myocytes from β2B-APEX2 mice and on α1C-APEX2 cardiomyocytes that demonstrate nisoldipine-resistant current (Fig. 3B). For α1C-APEX2 cardiomyocytes, isoproterenol is perfused with nisoldipine.
3.3. Visualize trafficking of APEX2-CaV1.2 subunits to the Z-disk and subsequent dyadic labeling
Coat the wells of a chambered slide with 1 mg/mL laminin for 1 h at 37 °C and then wash twice with PBS.
Allow isolated APEX2-CaV1.2 myocytes to settle on the laminin-coated glass bottom.
Incubate myocytes with 500 μM biotin-phenol for 30 min.
Initiate enzyme catalyzed labeling in half of the wells with 1 mM H2O2 for 1 min before washing cells in ice cold quenching buffer (5 mM Trolox, 10 mM sodium ascorbate, 10 mM sodium azide in PBS) three times.
Fix cells in 4% paraformaldehyde and wash with 100 mM glycine in PBS twice.
Permeabilize cells with 0.1% Triton X-100 for 5 min and block cells with 3% bovine serum albumin (BSA) in PBS for 1 h.
Stain cells with a 1/800 dilution of streptavidin-Alexa Fluor 488 (Thermofisher, S32354), 1/500 mouse anti-V5 IgG (Thermofisher, R960–25), and 1/200 goat anti-mouse IgG conjugated to Alexa Fluor 594 (Thermofisher, A11032).
Image myocytes, with appropriate negative controls, using a confocal microscope (Fig. 4A).
Fig. 4.
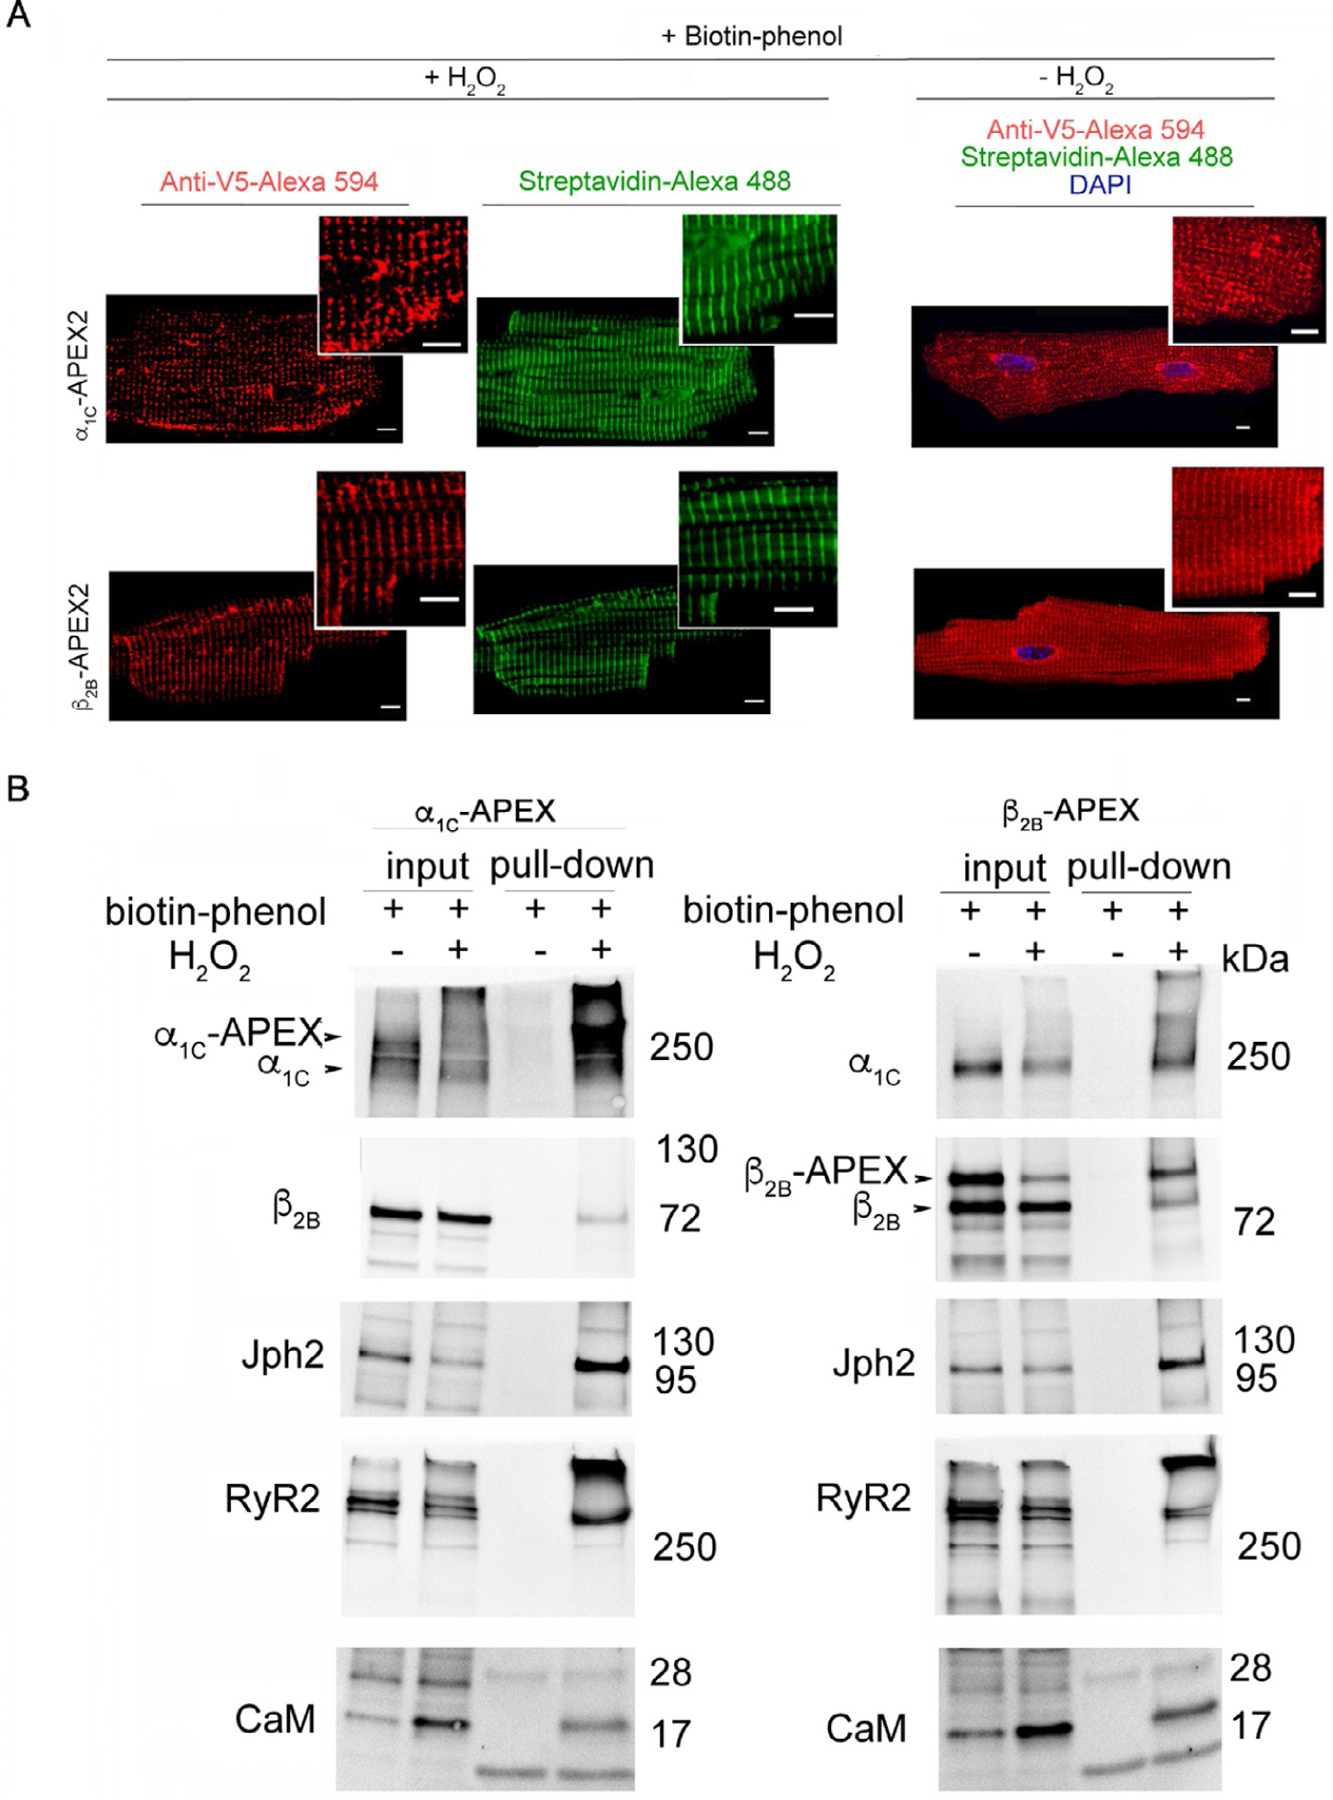
(A) Anti-V5 antibody detection of APEX2 fused to CaV1.2 subunits produces a similar Z-disc staining pattern as typically seen in immunofluorescence of endogenous CaV1.2 subunits. Streptavidin-488 fluorescence imaging of myocytes isolated from α1C-APEX2 and β2B-APEX2 transgenic mice also shows a Z-disc staining pattern in cells treated with biotin-phenol and H2O2. Enzyme catalyzed APEX2-labeling of the CaV1.2 microenvironment is undetectable in the absence of H2O2. (B) APEX2-labeling of α1C-APEX2 and β2B-APEX2 transgenic mouse heart biotinylates known interactors of CaV1.2, including other CaV1.2 subunits, Junctophilin-2 (Jph2), Ryanodine-2 (RyR2) and Calmodulin (CaM).
3.4. Biochemical validation of APEX2-CaV1.2 labeling in intact myocytes
Isolate myocytes as described above.
Divide cells into two microcentrifuge tubes, allow to settle, aspirate the supernatant, and resuspend in myocyte isolation buffer containing 500 μM biotin-phenol. Gently agitate or rock for 30 min.
Initiate APEX2 labeling of the cells in one tube by adding 1 mM H2O2 for 1 min, then wash three times with quenching buffer (5 mM Trolox, 10 mM sodium ascorbate, 10 mM sodium azide in PBS).
Allow cells to settle for 5 min, resuspend the pellet in lysis buffer (described above) and briefly vortex.
Precipitate cell membranes and debris, denature lysates, and resolve them on an acrylamide gel prior to transferring to nitrocellulose.
Blot with streptavidin-HRP (Thermofisher, S911) to confirm effective proximity biotin-labeling (Fig. 5B).
As before, affinity-purify biotin-labeled neighbors of CaV1.2 subunits on streptavidin magnetic beads (Thermofisher, #88817) and elute biotinylated proteins in denaturing buffer (see Section 2.2, list 12).
In a series of Western blots, confirm biotinylation of the channel itself and known near-neighbors (e.g., with antibodies against calmodulin, junctophilin-2, ryanodine-2, etc.; Fig. 4B).
Fig. 5.
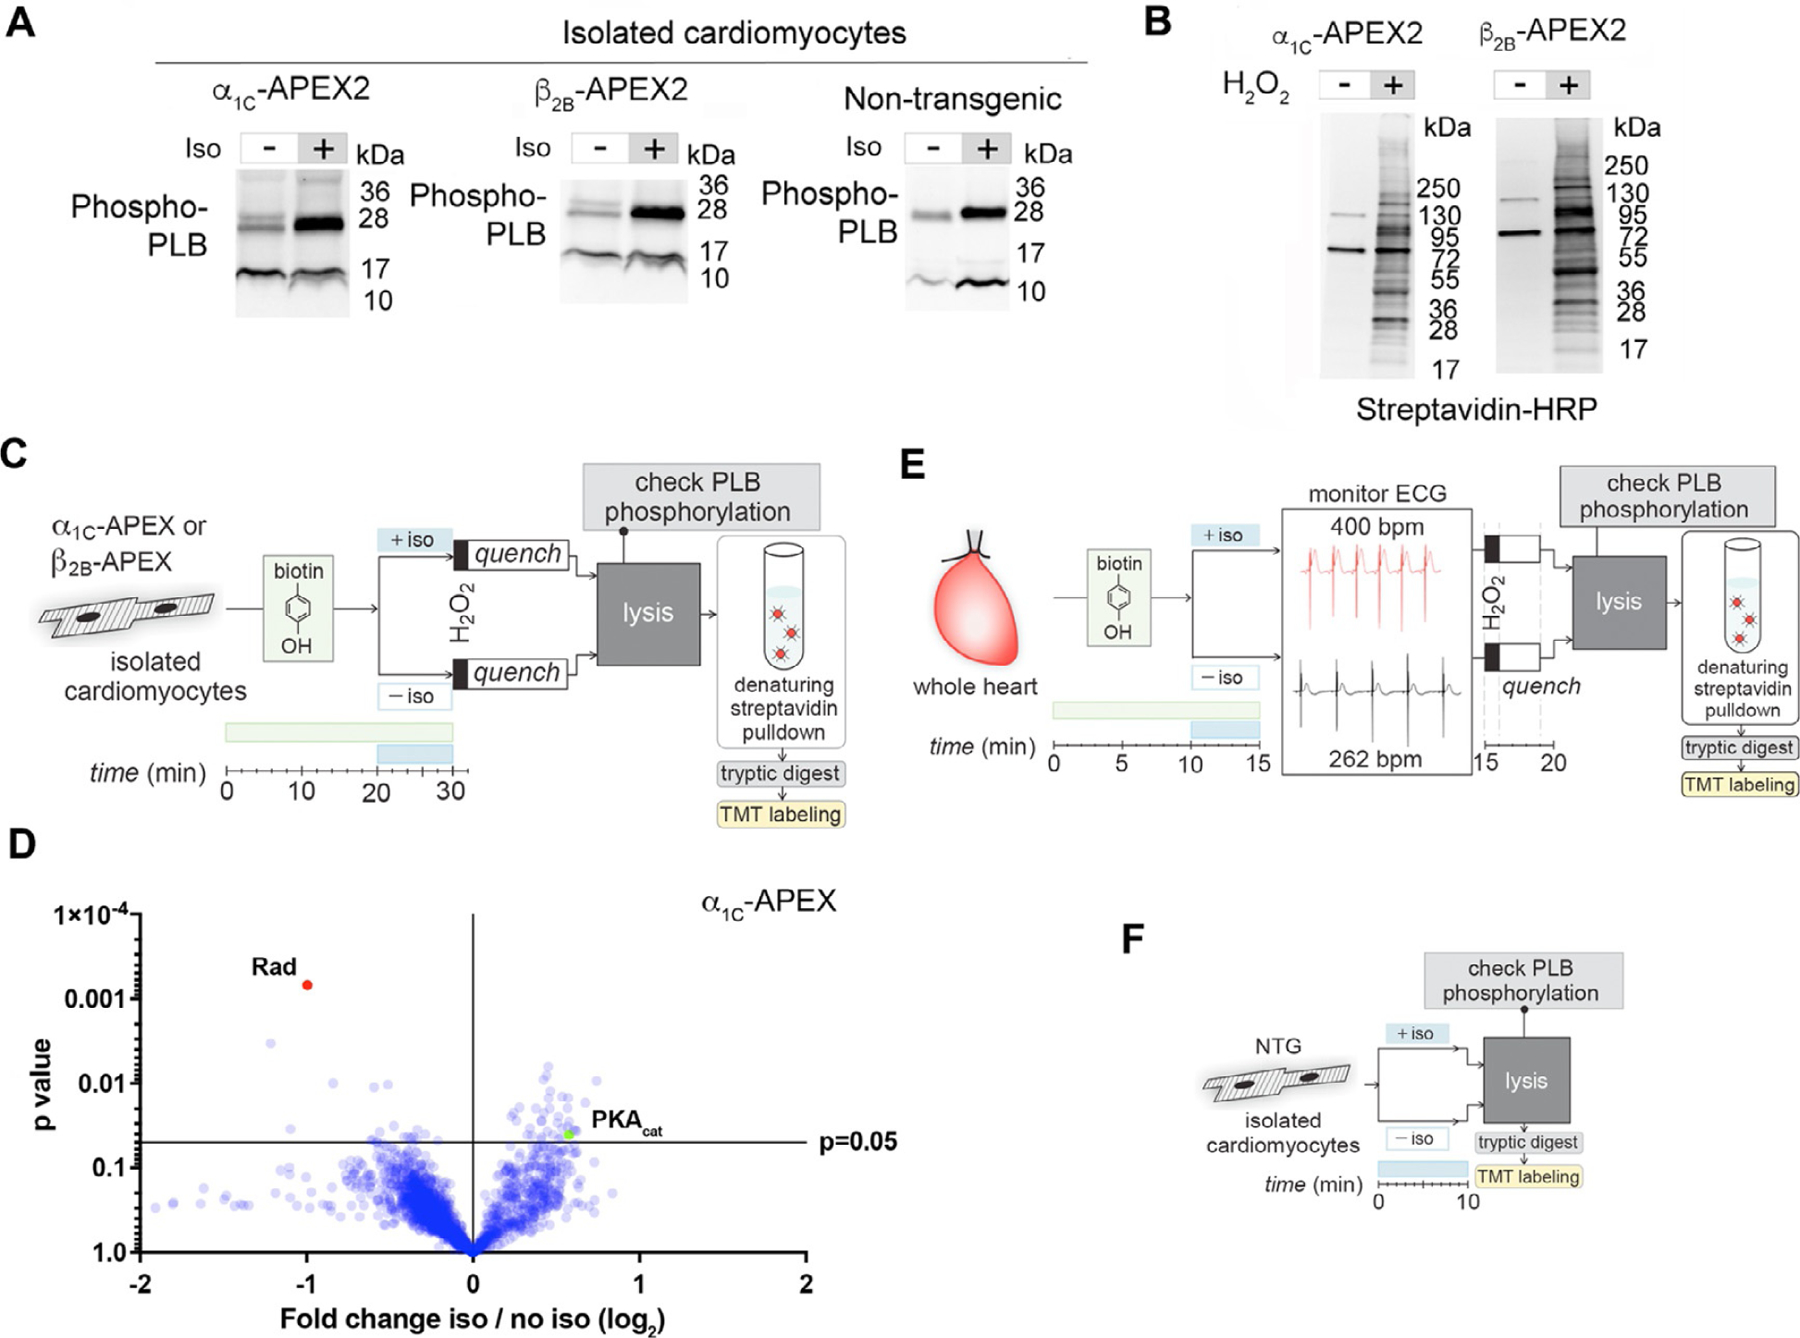
(A) Anti-phospho-phospholamban immunoblots of transgenic α1C-APEX2 and β2B-APEX2 cardiomyocyte lysates after treatment with vehicle or 1 μM isoproterenol for 10 min. (B) Streptavidin-HRP blotting of electrophoretically resolved lysates of transgenic APEX cardiomyocytes treated with biotin-phenol and H2O2 produces a characteristic ladder pattern, indicating APEX-labeling of small and larger proteins. (C) Workflow for in vitro proximity labeling the CaV1.2 interactome in live, adult, differentiated mouse cardiomyocytes. (D) The volcano plot shows statistical significance as a function of relative change in protein quantification by TMT mass spectrometry of α1C-APEX2 myocytes, with and without exposure to isoproterenol, demonstrating significant biotin-labeling of Rad in untreated cells only. (E) Workflow for ex vivo APEX2-catalyzed proximity labeling of the CaV1.2 microdomain in the intact heart. As in isolated myocytes, biotinylation of Rad in the intact heart was similarly reduced after isoproterenol treatment, which in this case was through 5 min of retrograde perfusion of 1 μM isoproterenol. (F) Workflow for development of a control dataset of wildtype mouse myocytes exposed to biotin-phenol and H2O2 before and after isoproterenol treatment. β-Adrenergic stimulation does not cause a significant change in Rad detection from wildtype mouse lysates, suggesting total myocyte protein levels of Rad do not change, though proximity to the channel does.
4. Unbiased characterization of the cardiac CaV1.2 interactome in isolated myocytes
To improve the reliability of proximity labeling, it is recommended to simultaneously analyze multiple replicates in each group. A minimum of three per group is strongly advised. We recommend preparing all materials for MS together to reduce variability between samples during preparation. There are now available tandem mass-tag sets that allow quantitative mass spectrometric analysis of up to 16 samples at one time. Our sample preparation protocol was recently explained in depth elsewhere (Kalocsay, 2019; Liu et al., 2020). Note that proteomics core facilities may have individualized sample preparation recommendations or requests, so it is advised to discuss with them the experimental plan prior to beginning this analysis.
Isolate cardiac myocytes from APEX2-CaV1.2 or wild-type mice.
Incubate cells with biotin-phenol followed by H2O2 treatment and quenching as previously described. For an additional, transgenic mouse-specific control, incubate the cells with biotin-phenol but do not add H2O2.
Allow cells to settle in microcentrifuge tubes prior to removing quenching buffer. We freeze the cell pellets at −80 °C prior to cell lysis.
After collecting and labeling myocytes from α1C-APEX2 mice, β2B-APEX2 mice, and C57BL/6 control mice, thaw the cells on ice in lysis buffer, homogenize with a thoroughly cleaned rotostator, and remove cell debris by centrifuging at 21,130 × g at 4 °C for 10 min.
Confirm successful biotinylation of myocytes from each APEX2-CaV1.2 transgenic mouse heart using streptavidin-HRP before including this material in quantitative proteomics experiments.
Set aside 2 mg of protein for each mouse in a fresh microcentrifuge tube. Precipitate by adding a 1:1 volume of ice-cold 55% trichloroacetic acid and incubating on ice for 15 min.
Centrifuge at 21,130 × g at 4 °C for 10 min.
Remove the supernatant and vortex the pellet in −20 °C acetone. Centrifuge the pellet again at 21,130 × g at 4 °C for 10 min. Repeat the acetone wash and pellet three more times.
Allow the pellets to air-dry in open microcentrifuge tubes for 5 min, then completely resuspend the pellet in freshly made 8 M urea denaturing buffer (pH 8 with 100 mM sodium phosphate) with continuous nutation at room temperature. This step may require overnight nutation. Pellet sizes can vary between similar samples. Larger pellet size and other factors may increase the time required to achieve complete dissolution of the pellet.
Reduce disulfide bonds by adding 500 mM Tris(2-carboxyethyl) phosphine dissolved in H2O, pH 7.5 (adjusted with sodium hydroxide titration) and agitating at room temperature for 1 h..
Alkylate reduced cysteines by adding 400 mM iodoacetamide, which must be dissolved in 50 mM ammonium bicarbonate immediately before use. Incubate in the dark at room temperature for 25 min.
Quench this reaction with the addition of dithiothreitol to a final concentration of 50 mM.
Add distilled water to reduce urea concentration to 2 M, and then add filtered sodium dodecyl sulfate (SDS) to a final concentration of 0.25% (w/v).
Incubate alkylated proteins during overnight nutation with 75 μL of washed streptavidin beads at 4 °C.
The following day, wash beads three times in fresh 4 M urea buffer, pH 8, with filtered 0.5% SDS.
Wash beads three times in 4 M urea buffer, pH 8, without SDS. Before the final wash, gently transfer the beads to new microcentrifuge tubes.
Remove supernatant. Set aside 10% of beads for elution at 95 °C and confirmation of successful affinity-purification by blotting resolved eluate with streptavidin-HRP. Note, this blot can be used to normalize MS input based on the intensity of biotinylation present in each sample.
Store the remaining beads at −80 °C and deliver to the proteomics laboratory on dry ice.
Perform multiplexed quantitative mass spectrometry using tryptic on-bead digestion of purified proteins, combined with tandem mass tag peptide labeling (TMT), alkaline reversed-phase peptide fractionation, and SPS MS3 mass spectrometry as described (Kalocsay, 2019; Liu et al., 2020).
5. Labeling the beating heart
Labeling in the spontaneously beating Langendorff-perfused heart can add several unique insights. As stated before, we gain confidence for proteins common to each different labeling methodology (isolated β2B-APEX2 myocytes, isolated α1C-APEX2 myocytes, whole-heart). By leaving the heart intact, we are also able to preserve myocyte-myocyte interactions, myocyte-matrix interactions, and maintain ventricular wall stress at a level more similar to that in a live animal. These strategies may help us avoid detecting changes in the channel neighborhood that are an effect or consequence of the isolation protocol and not a true physiologic reflection of CaV1.2 biology.
Perform cardiectomy on sedated, heparinized APEX2-CaV1.2 or wild-type C57BL/6.
Cannulate the aorta and begin retrograde perfusion of heated, carboxygenated, and filtered Krebs buffer for 10 min.
Perfuse the heart with 500 μM biotin-phenol in heated, carboxygenated (5% CO2, 95% O2) Krebs buffer for 15 min. Note, biotin-phenol will stick to filtration membranes; to ensure successful retrograde perfusion spin the 500 mM stock solution at 21,130 × g to remove any non-solubilized biotin-phenol.
To ensure viability of the preparation, record a continuous two-lead ECG throughout the experiment, visualized with ADInstruments PowerLab software.
Perfuse with 1 mM H2O2 in Krebs buffer for 1 min. We recommend one of two methods to ensure precise labeling timing: (1) Transfer the perfusion inflow cannula to a tube of H2O2-Krebs buffer for precisely 1 min. With this approach the inflow cannula must be placed in the quenching buffer reservoir precisely 60 s after H2O2 perfusion began. (2) A small bubble is introduced into the perfusion tubing immediately before H2O2 is added. With this approach, it is critical to have a bubble trap in the tubing just prior to the aorta cannula. Note, spontaneous contraction of the heart will cease during H2O2 perfusion.
Perfuse quenching solution for 5 min, decannulate the heart and remove the atria. Freeze the left ventricle at −80 °C for later processing.
After labeling all hearts, thaw ventricles in 1 mL of ice-cold lysis buffer in a 5 mL conical. While the heart is thawing, chop it into small pieces with sharp scissors and homogenize the pieces with a rotostator, on ice.
Precipitate cell membranes and other debris with centrifugation at 21,130 × g at 4 °C for 10 min and proceed to the sample preparation as outlined in Section 4.
6. Characterization of the cardiac CaV1.2 interactome after β-adrenergic stimulation
6.1. Isolated myocytes
In this experiment, the treatment group is exposed to isoproterenol (with biotin-phenol) for 10 min prior to initiating labeling with H2O2. Since every transgenic mouse can have slightly different amounts of transgene expression, and there can be subtle changes in isoproterenol treatment and response, one must combine the myocytes from two mice, mix them, and then treat only half of the cells. In this way, every replicate is the same in every regard but for isoproterenol treatment and is its own internal control.
Isolate cardiac myocytes from the hearts of two 8–12 weeks old α1C-APEX2 or β2B-APEX2 mice.
Combine the myocytes from both hearts, gently mix, and then split into two tubes.
Incubate both tubes with 500 μM biotin-phenol at room temperature for 30 min.
20 min into the biotin-phenol incubation, add 1 μM isoproterenol to one tube.
Initiate biotin-labeling of all samples with 1 mM H2O2. Subsequently, wash the cells three times with quenching buffer, supplemented with phosphatase inhibitor (Sigma 4906845001).
Lyse cells and precipitate debris with centrifugation at 21,130 × g at 4 °C for 10 min. In this experiment, the lysis buffer also contains phosphatase inhibitors.
Confirm successful biotin-labeling by blotting resolved lysate with streptavidin-HRP.
Before preparing lysates for mass spectrometry as outlined in Section 4, confirm the adequacy of isoproterenol treatment by immunoblotting resolved lysates with a 1/1000 dilution of anti-phospho-phospholamban (Ser16/Thr17) antibody (Cell Signaling 8496; Fig. 5A). Note: to avoid excess basal adrenergic stimulation in myocytes that is independent of isoproterenol treatment, extra efforts should be made to handle mice as gently as possible and avoid exposure to bright lights or loud sounds in the hour prior to myocyte isolation.
Affinity-purify biotinylated proteins as described in Section 2.2, list 12.
Perform multiplexed quantitative MS using tryptic on-bead digestion of purified proteins, combined with tandem mass tag peptide labeling (TMT), alkaline reversed-phase peptide fractionation, and SPS MS3 mass spectrometry as described (Kalocsay, 2019; Liu et al., 2020) (Fig. 5C and D).
To compare global changes during adrenergic stimulation versus changes specific to the CaV1.2 interactome, we recommend performing SPS MS3 TMT mass spectrometry on C57BL/6 mice in pairs, with half of the isolated myocytes exposed to isoproterenol and the other half vehicle (Fig. 5F). This material would be lysed in phosphatase inhibitor and sent directly for mass spectrometry—no pulldown necessary. In this way, we can tell if a protein de-enriched from an APEX2 mass-spectrometry list after isoproterenol treatment is less abundant in the cell, or if it has only left the channel microenvironment.
6.2. Whole, intact heart
In this experiment also, special efforts must be taken to prevent a fearful response in mice prior to retrograde perfusion of APEX2-labeling reagents and isoproterenol through the coronary circulation. There is no way to isoproterenol-treat only half of the cells in the perfused, intact heart. As such, each mouse will serve as a replicate for a single experimental condition (isoproterenol or vehicle treatment). As an additional step to prevent excess adrenergic stimulation in untreated hearts, all mice in this experiment are pre-treated with propranolol before cardiectomy. In Langendorff-perfused hearts, 1 μM isoproterenol is sufficiently potent to compete off the mixed β-adrenergic receptor blocker and initiate downstream signaling.
10 min prior to cardiectomy, inject mice with propranolol 5 mg/kg I.P.
As in Section 5, initiate retrograde perfusion of APEX2-CaV1.2 subunit mouse hearts with filtered, heated Krebs buffer via Langendorff preparation for 10 min, then add 500 μM biotin-phenol for an additional 15-min perfusion (Fig. 5E).
In the final 5 min of biotin-phenol perfusion, add vehicle (water) or 1 μM isoproterenol to the perfusate. Perfuse with H2O2 in the final minute to initiate labeling.
Rapidly cannulated, well-perfused propranolol-treated mouse heart will spontaneously beat at approximately 250 beats per minute. This rate will nearly double in hearts that respond well to isoproterenol.
Perfuse the heart with quenching buffer supplemented with phosphatase inhibitor for 5 min. Decannulate the heart, excise the atria, and store the heart frozen at −80 °C until rest of the hearts have been labeled.
See Section 5 for instructions on preparing intact, labeled heart for quantitative mass spectrometry. The main difference to keep in mind is that the lysis buffer should contain phosphatase inhibitor.
7. Conclusion
In this chapter, we describe protocols for application of the novel technique of proximity proteomics to the study of cardiovascular ion channels. Key to our initial success was having a biological question well-suited to this technique: the search for an unknown element of the CaV1.2 microdomain responsible for transducing β-adrenergic signaling to the channel. To increase the likelihood of obtaining meaningful data from proximity proteomics, we first had to confirm that adrenergic signaling and Ca2+ channel function were unaffected by the transgenic mouse model system. Rad was detected in multiple complementary APEX2-labeling approaches, increasing the likelihood this interaction was truly relevant. It should be emphasized that while the identification of Rad took a great deal of effort, it was only the first of several steps in confirming its role in the β-adrenergic regulation of CaV1.2 (Liu et al., 2020; Papa et al., 2020).
References
- Agou F, & Veron M (2015). In vivo protein cross-linking. Methods in Molecular Biology, 1278, 391–405. 10.1007/978-1-4939-2425-7_26. [DOI] [PubMed] [Google Scholar]
- Branon TC, Bosch JA, Sanchez AD, Udeshi ND, Svinkina T, Carr SA, et al. (2018). Efficient proximity labeling in living cells and organisms with TurboID. Nature Biotechnology, 36(9), 880–887. 10.1038/nbt.4201. [DOI] [PMC free article] [PubMed] [Google Scholar]
- Choi H, Liu G, Mellacheruvu D, Tyers M, Gingras AC, & Nesvizhskii AI (2012). Analyzing protein-protein interactions from affinity purification-mass spectrometry data with SAINT. Current Protocols in Bioinformatics, 39(1), 8.15.1–8.15.23. 10.1002/0471250953.bi0815s39. Chapter 8, Unit8.15. [DOI] [PMC free article] [PubMed] [Google Scholar]
- Hambleton M, York A, Sargent MA, Kaiser RA, Lorenz JN, Robbins J, et al. (2007). Inducible and myocyte-specific inhibition of PKCalpha enhances cardiac contractility and protects against infarction-induced heart failure. American Journal of Physiology. Heart and Circulatory Physiology, 293(6), H3768–H3771. 10.1152/ajpheart.00486.2007. [DOI] [PMC free article] [PubMed] [Google Scholar]
- He M, Bodi I, Mikala G, & Schwartz A (1997). Motif III S5 of L-type calcium channels is involved in the dihydropyridine binding site. A combined radioligand binding and electrophysiological study. The Journal of Biological Chemistry, 272(5), 2629–2633. 10.1074/jbc.272.5.2629. [DOI] [PubMed] [Google Scholar]
- Hockerman GH, Johnson BD, Abbott MR, Scheuer T, & Catterall WA (1997). Molecular determinants of high affinity phenylalkylamine block of L-type calcium channels in transmembrane segment IIIS6 and the pore region of the alpha1 subunit. The Journal of Biological Chemistry, 272(30), 18759–18765. [DOI] [PubMed] [Google Scholar]
- Hung V, Zou P, Rhee HW, Udeshi ND, Cracan V, Svinkina T, et al. (2014). Proteomic mapping of the human mitochondrial intermembrane space in live cells via ratiometric APEX tagging. Molecular Cell, 55(2), 332–341. 10.1016/j.molcel.2014.06.003. [DOI] [PMC free article] [PubMed] [Google Scholar]
- Iacobucci I, Monaco V, Cozzolino F, & Monti M (2021). From classical to new generation approaches: An excursus of -omics methods for investigation of protein-protein interaction networks. Journal of Proteomics, 230, 103990. 10.1016/j.jprot.2020.103990. [DOI] [PubMed] [Google Scholar]
- Kalocsay M (2019). APEX peroxidase-catalyzed proximity labeling and multiplexed quantitative proteomics. Methods in Molecular Biology, 2008, 41–55. 10.1007/978-1-4939-9537-0_4. [DOI] [PubMed] [Google Scholar]
- Lam SS, Martell JD, Kamer KJ, Deerinck TJ, Ellisman MH, Mootha VK, et al. (2015). Directed evolution of APEX2 for electron microscopy and proximity labeling. Nature Methods, 12(1), 51–54. 10.1038/nmeth.3179. [DOI] [PMC free article] [PubMed] [Google Scholar]
- Liu G, Papa A, Katchman AN, Zakharov SI, Roybal D, Hennessey JA, et al. (2020). Mechanism of adrenergic CaV1.2 stimulation revealed by proximity proteomics. Nature, 577(7792), 695–700. 10.1038/s41586-020-1947-z. [DOI] [PMC free article] [PubMed] [Google Scholar]
- Lobingier BT, Huttenhain R, Eichel K, Miller KB, Ting AY, von Zastrow M, et al. (2017). An approach to spatiotemporally resolve protein interaction networks in living cells. Cell, 169(2), 350–360.e312. 10.1016/j.cell.2017.03.022. [DOI] [PMC free article] [PubMed] [Google Scholar]
- Martell JD, Deerinck TJ, Sancak Y, Poulos TL, Mootha VK, Sosinsky GE, et al. (2012). Engineered ascorbate peroxidase as a genetically encoded reporter for electron microscopy. Nature Biotechnology, 30(11), 1143–1148. 10.1038/nbt.2375. [DOI] [PMC free article] [PubMed] [Google Scholar]
- Mellacheruvu D, Wright Z, Couzens AL, Lambert JP, St-Denis NA, Li T, et al. (2013). The CRAPome: A contaminant repository for affinity purification-mass spectrometry data. Nature Methods, 10(8), 730–736. 10.1038/nmeth.2557. [DOI] [PMC free article] [PubMed] [Google Scholar]
- Paek J, Kalocsay M, Staus DP, Wingler L, Pascolutti R, Paulo JA, et al. (2017). Multidimensional tracking of GPCR signaling via peroxidase-catalyzed proximity labeling. Cell, 169(2), 338–349.e311. 10.1016/j.cell.2017.03.028. [DOI] [PMC free article] [PubMed] [Google Scholar]
- Papa A, Kushner JS, Hennessey JA, Katchman AN, Zakharov SI, Chen BX, et al. (2020). Adrenergic CaV1.2 activation via rad phosphorylation converges at alpha1C I-II loop. Circulation Research, 128, 76–88. 10.1161/CIRCRESAHA.120.317839. [DOI] [PMC free article] [PubMed] [Google Scholar]
- Rhee HW, Zou P, Udeshi ND, Martell JD, Mootha VK, Carr SA, et al. (2013). Proteomic mapping of mitochondria in living cells via spatially restricted enzymatic tagging. Science, 339(6125), 1328–1331. 10.1126/science.1230593. [DOI] [PMC free article] [PubMed] [Google Scholar]
- Roux KJ, Kim DI, Raida M, & Burke B (2012). A promiscuous biotin ligase fusion protein identifies proximal and interacting proteins in mammalian cells. The Journal of Cell Biology, 196(6), 801–810. 10.1083/jcb.201112098. [DOI] [PMC free article] [PubMed] [Google Scholar]
- Sanbe A, Gulick J, Hanks MC, Liang Q, Osinska H, & Robbins J (2003). Reengineering inducible cardiac-specific transgenesis with an attenuated myosin heavy chain promoter. Circulation Research, 92(6), 609–616. 10.1161/01.RES.0000065442.64694.9F. [DOI] [PubMed] [Google Scholar]
- Yang L, Katchman A, Kushner J, Kushnir A, Zakharov SI, Chen BX, et al. (2019). Cardiac CaV1.2 channels require beta subunits for beta-adrenergic-mediated modulation but not trafficking. The Journal of Clinical Investigation, 129(2), 647–658. 10.1172/JCI123878. [DOI] [PMC free article] [PubMed] [Google Scholar]
- Yang L, Katchman A, Samad T, Morrow J, Weinberg R, & Marx SO (2013). Beta-adrenergic regulation of the L-type Ca2 + channel does not require phosphorylation of alpha1C Ser1700. Circulation Research, 113(7), 871–880. 10.1161/CIRCRESAHA.113.301926. [DOI] [PMC free article] [PubMed] [Google Scholar]