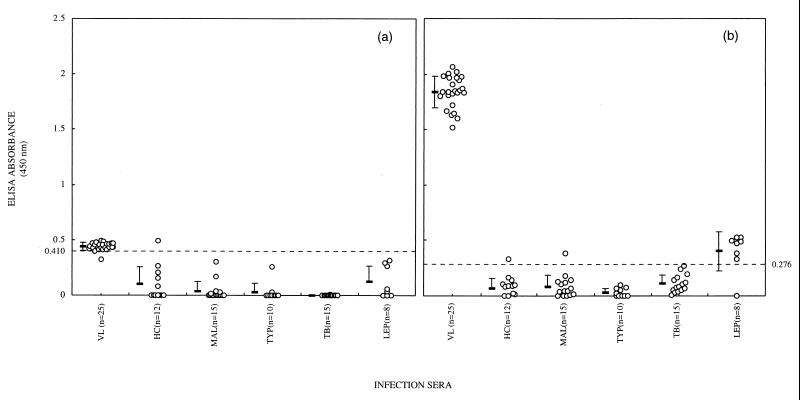
FIG. 1.
Dot plots showing specific IgG responses (absorbance values) of sera from healthy controls and patients with visceral leishmaniasis, malaria, typhoid, tuberculosis, and leprosy to leishmanial lysate (a) and LAg (b). The horizontal bars represent the means ± standard deviations for the different groups. The dotted line indicates the cutoff value (mean of healthy controls + 2 standard deviations).

