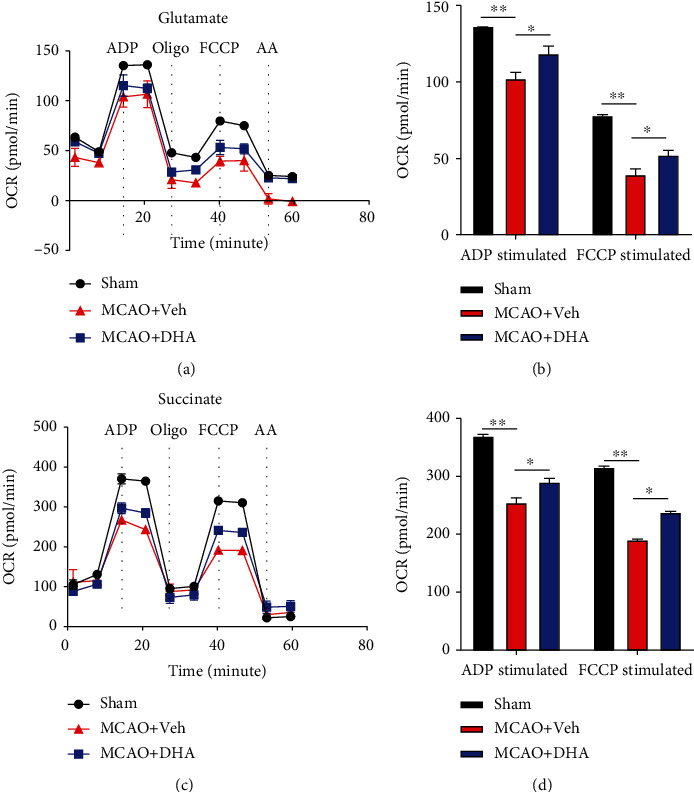
Figure 5.

DHA increased mitochondrial metabolism in the MCAO model. (a) The OCR of mitochondria isolated from the penumbra was measured under glutamate stimulation and in response to treatment with the indicated drugs (4-mM ADP, 2.5-μg/mL oligo, 4-μM FCCP, and 4-μM AA) in each group. (b) The OCR of ADP- and FCCP-stimulated mitochondrial respiration in each group. (c) The OCR of mitochondria isolated from the penumbra was measured under succinate stimulation and in response to treatment with the indicated drugs (4-mM ADP, 2.5-μg/mL oligo, 4-μM FCCP, and 4-μM AA) in each group. (d) The OCR of ADP- and FCCP-stimulated mitochondrial respiration in each group. Data are expressed as mean ± SEM (n =6 animals from each group) (∗, P < 0.05; ∗∗, P < 0.01). One-way ANOVA followed by Tukey's post hoc test was used for data comparison. OCR: oxygen consumption rate; ADP: adenosine diphosphate; Oligo: oligomycin; FCCP: carbonyl cyanide p-trifluoromethoxy-phenylhydrazone; AA: antimycin A.
