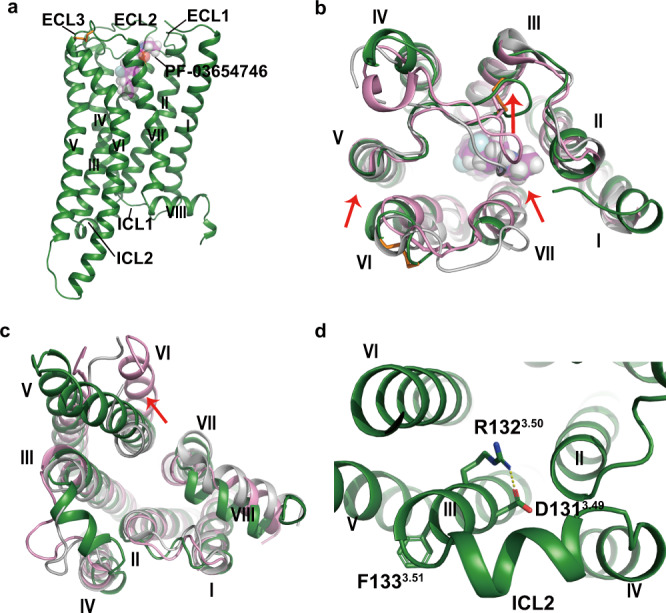
Fig. 1. Overall structure of H3R–PF-03654746 complex.

a Membrane view of H3R–PF-03654746 structure. H3R was shown in forest green ribbons. PF-03654746 was shown in a magenta sphere. The disulfide bond was shown as orange sticks. b, c Structural comparison of H3R (forest green) with inactive H1R (gray, PDB ID: 3RZE) and active H1R (pink, PDB ID: 7DFL) from extracellular view (b) and intracellular view (c). d Intracellular view showing a salt-bridge interaction (yellow dashed line) between D1313.49 and R1323.50. The red arrows indicated movements of TMs5/6 and ECL2 in the H3R structure compared to the H1R inactive structure.
