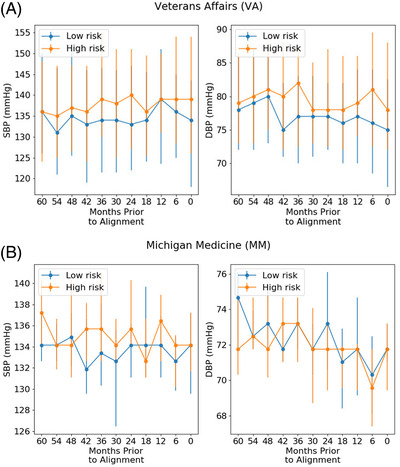
FIGURE 2.

Median trajectories. We show the median trajectories for systolic and diastolic blood pressure (abbreviated SBP and DBP, respectively) within different risk groups from the model trained on time series data. Risk groups were defined by the 10th and 90th percentiles of the model's predictions. Error bars represent interquartile ranges. (A) Veterans Affairs dataset; (B) Michigan Medicine dataset
