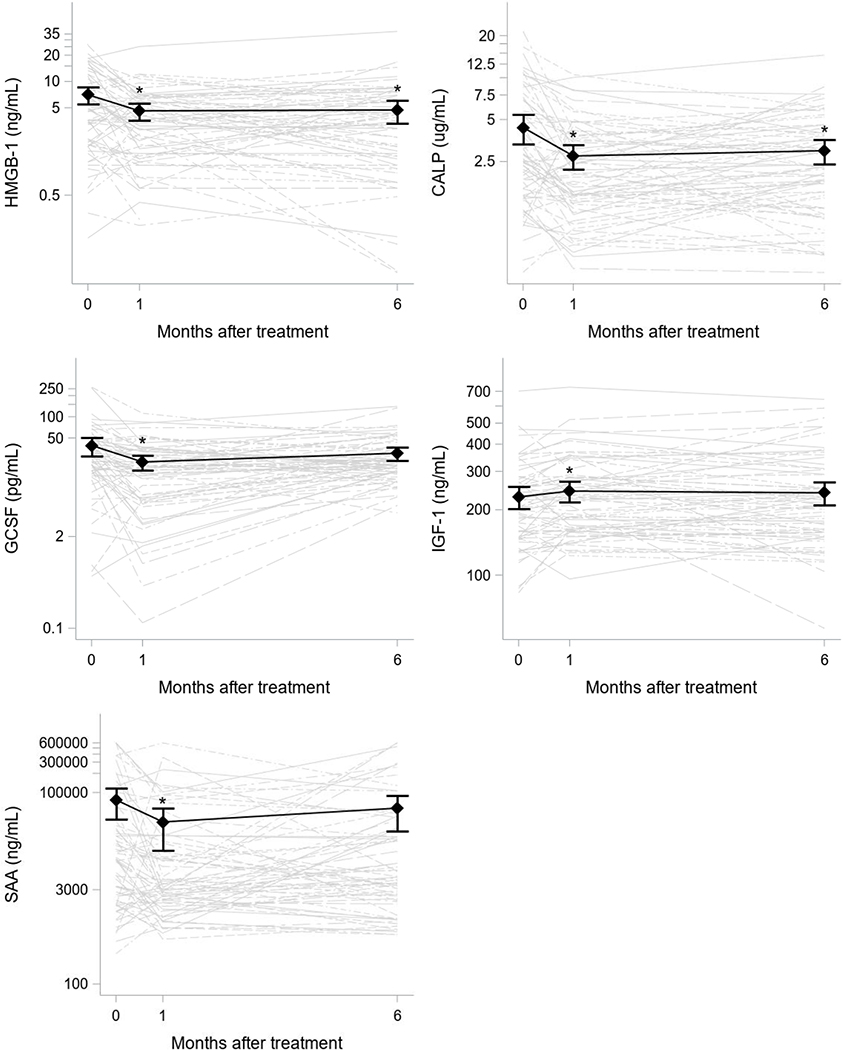
Figure 1. Changes in HMGB-1, calprotectin, G-CSF, and IGF-1 following 1 and 6 months of ivacaftor.
Protein concentrations for each subject over time are indicated by the grey lines. Means and 95% confidence intervals from the generalized linear regression models are overlaid in black. Stars indicate times at which the average protein concentrations were statistically significant from baseline.

