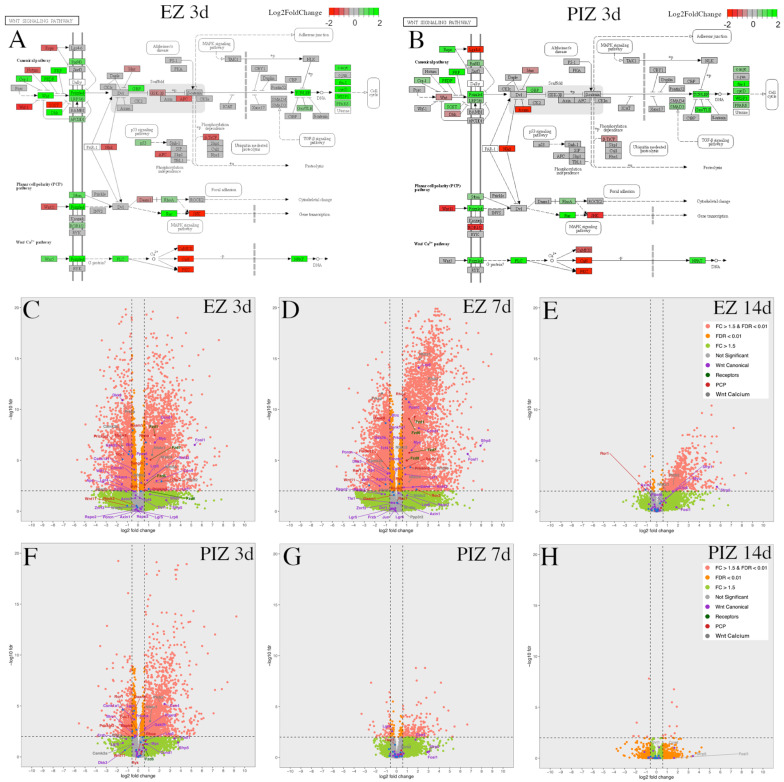
Figure 4.
Wnt pathway transcriptional dysregulation in the EZ and PIZ during the first 2 weeks of epileptogenesis. Modified KEGG pathways representing canonical and non-canonical planar cell polarity and calcium pathway Wnt signaling 3 days after SE induction in the (A) EZ and (B) PIZ. Scale bar represents log2 fold-change in transcription; green color denotes upregulation and red color denotes downregulation. Modified KEGG Wnt signaling pathways for other time-points can be found in Figure S3. Whole transcriptome volcano plots with Wnt signaling mediators individually labeled in the EZ (C) 3 days, (D) 7 days, and (E) 14 days, and in the PIZ (F) 3 days, (G) 7 days, and (H) 14 days after SE induction; dashed lines denote FDR < 0.01 and FC > ±1.5 (equivalent to log2 fold-change > ±0.585). Pink dots represent genes with FDR < 0.01, FC > ±1.5; orange dots represent genes with FDR < 0.01, FC < ±1.5; green dots represent genes with FDR > 0.01, FC > ±1.5; gray dots represent genes with FDR > 0.01, FC < ±1.5. Log2 fold-change values and adjusted p-values for these Wnt genes can be found in Table S6.

