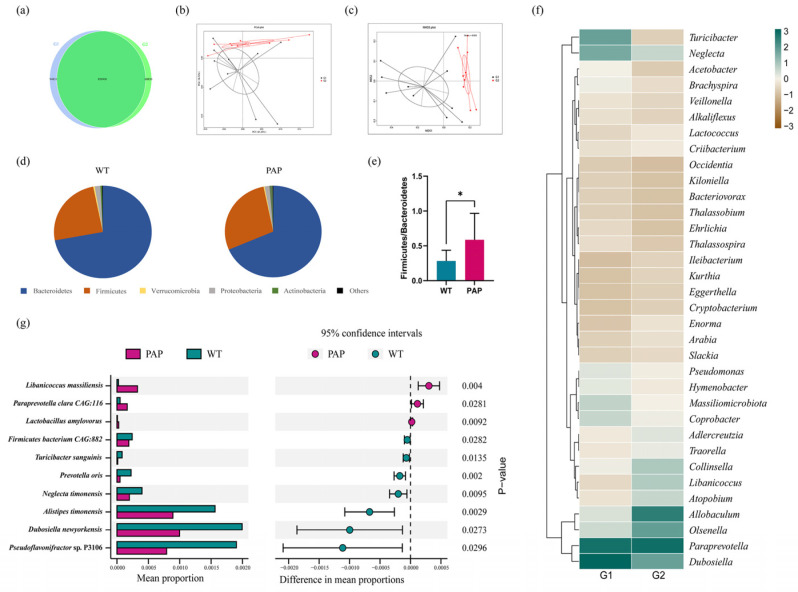
Figure 3.
The shift of gut microbiota in WT and PAP mice according to the metagenomics data. (a) Venn diagram of the number of genes in WT and PAP. (b) Principal coordinate analysis (PCoA) and (c) Non-Metric Multi-Dimensional Scaling (NMDS) of the microbiota based on Bray–Curtis. (d) Gut microbiota composition at the phylum level and (e) Firmicutes/Bacteroidetes ratio in PAP and WT mice. (f) Heatmap showed relative abundance of the top 35 genera across two groups. (g) Changes in the gut microbiota at the species level selected from stamp analysis. * p < 0.05 by student’s t-test. G1 = WT group, G2 = PAP group.

