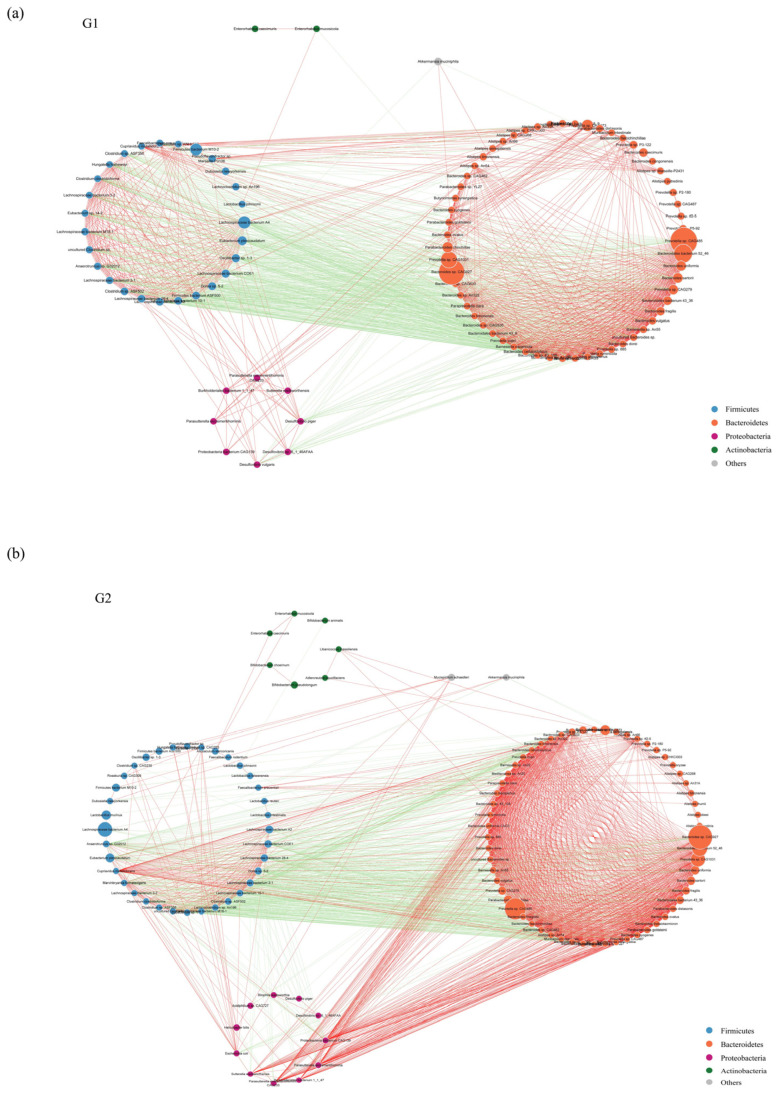
Figure 4.
Species co-occurrence network between WT (a) and PAP (b) mice based on the Spearman correlation algorithms. Each node presents a bacterial genus. The node size indicates the relative abundance of each species per group, and the density of the dashed line represents the Spearman coefficient. Red links stand for positive interactions between nodes, and green links stand for negative interactions. G1 = WT group, G2 = PAP group.

