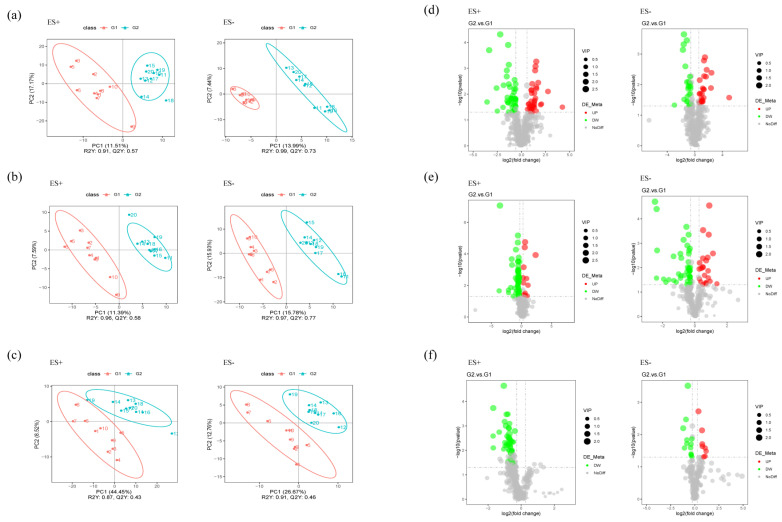
Figure 6.
Multivariate statistical analysis of untargeted metabolomics data in the samples (positive ion combined with negative ion). (a–c) PLS-DA score plot of metabolomics data for each pairwise group of feces, serum, and hippocampus, respectively. (d–f) Volcano plots for the model-separated metabolites according to the conditions of VIP > 1 and p < 0.05 with 95% confidence intervals.

