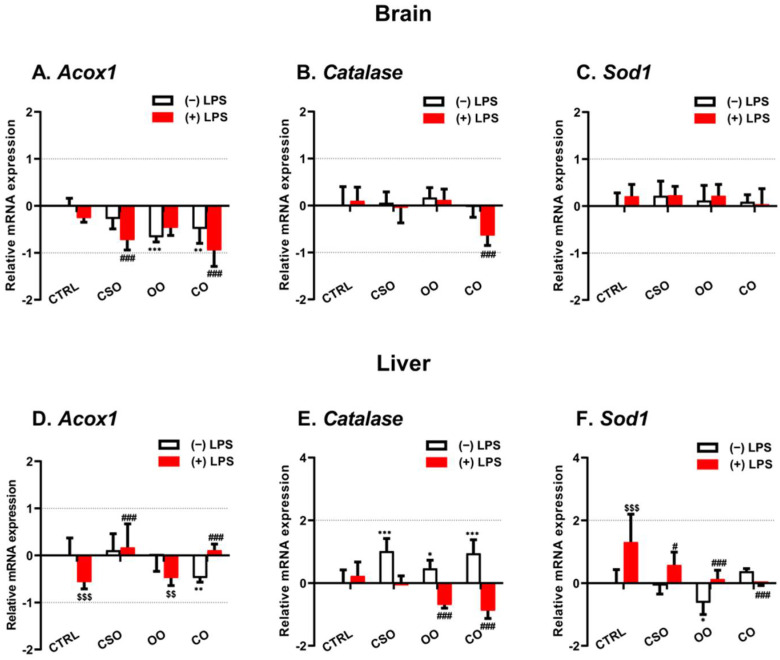
Figure 5.
Effect of cactus seed oil, olive oil, or colza oil treatment on gene expression of Acox1 (A,D), Cat (B,E), and Sod1 (C,F) in brain and liver, respectively. Male C57BL/6 mice received for 28 days a standard diet (control (CTRL)), a diet enriched with 6% (w/w) CSO, OO, or CO, and intravenous injection of LPS (100 µg) four hours antemortem. First, total RNA was isolated from mice brains and livers, and then the expression level of genes of interest was quantified by real-time RT-qPCR. All values are means ± SD (n = 3), statistical significance of higher mean signal (*** p ≤ 0.001. ** p ≤ 0.01. * p ≤ 0.05) compared to control, (### p ≤ 0.01, # p ≤ 0.05) compared to LPS, and ($$$ p ≤ 0.001. $$ p ≤ 0.01) compared to the different treatments with or without LPS administration. Statistics were executed using two-way ANOVA followed by Tukey test for multiple comparisons.

