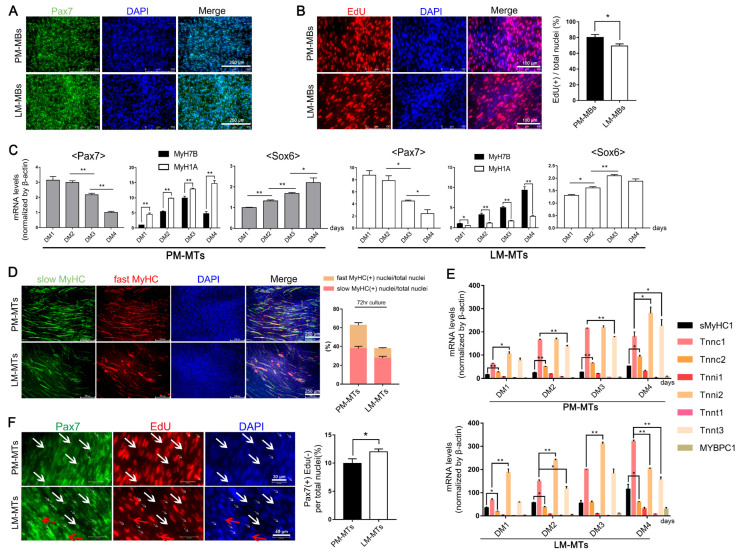
Figure 1.
Differences in the myogenic capacity of the satellite cells from fast- and slow-type muscles. (A) Freshly isolated satellite cells from PM and LM were stained with satellite cell marker Pax7 (green) and DAPI (blue). (B) Satellite cells isolated from PM and LM were cultured in the growth medium with EdU for 6 h. The proliferating cells were stained with Edu (red) and nuclei were stained with DAPI (blue) (mean ± SEM; * p < 0.05; n = 3; two-tailed Student’s t-test). (C) PM-MBs and LM-MBs were cultured in DM for 4 days, the relative expression levels of Pax7, MyH1A, MyH7B and Sox6 in myotubes in DM in different days were quantified by qPCR (mean ± SEM; * p < 0.05; ** p < 0.01; n = 3; two-tailed Student’s t-test or one-way analysis of variance with Tukey’s multiple comparison test). (D) After inducing differentiation for 3 days, myotubes in PM-MTs and LM-MTs were performing double immunofluorescence staining with S58 (slow-type MyHC, green) and F59 (fast-type MyHC, red) and nuclei were stained with DAPI (blue). The slow MyHC(+) nuclei or fast MyHC(+) nuclei were counted and the proportion of slow MyHC(+) cells or fast MyHC(+) cells relative to the total nuclei was quantified (mean ± SEM; n = 3). (E) The relative expression levels of the slow-type fiber isoforms sMyHC1, Tnnc1, Tnni1, Tnnt1, MYBPC1 and the fast-type fiber isoforms Tnnc2, Tnni2, Tnnt3 in PM-MTs and LM-MTs in DM in different days were quantified by qPCR (mean ± SEM; * p < 0.05; ** p < 0.01; n = 3; one-way analysis of variance with Tukey’s multiple comparison test). (F) PM-MBs and LM-MBs were cultured in DM for 5 days and EdU was added to the culture medium 24 h prior to harvest. In the end, the cells were stained with Pax7 (green) and EdU (red) (mean ± SEM; * p < 0.05; n = 3; two-tailed Student’s t-test). White arrows represent part of the typical Pax7(+)EdU(−) cells and red arrows represent part of the typical Pax7(+)EdU(+) cells.

