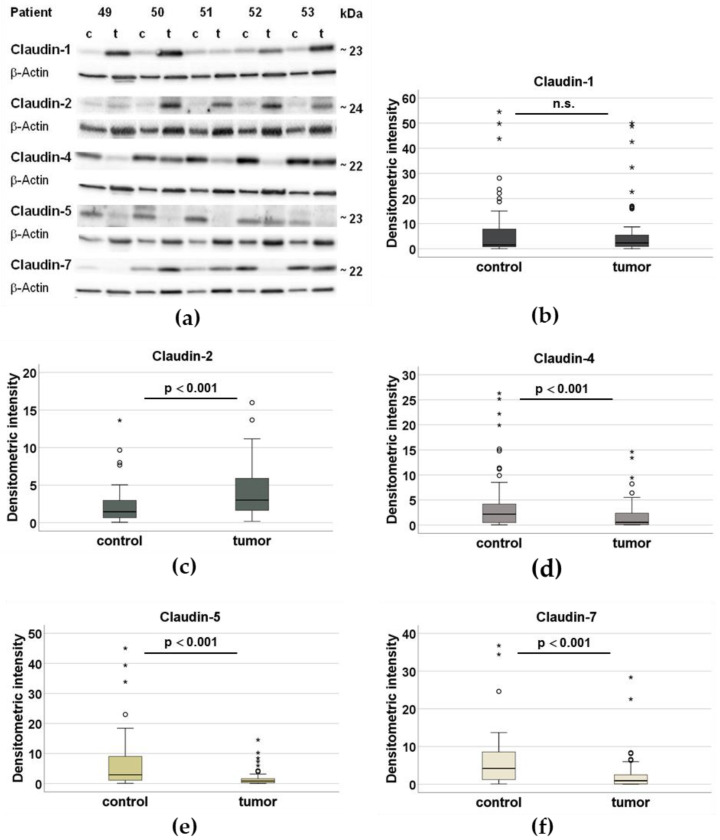
Figure 1.
Analysis of claudin expression using Western blots. (a) Western blot analysis of the claudins in the control tissue (c) and the respective tumor tissue (t) of patients 49–53, normalized by the loading control ß-actin (42 kDa). The intra-individual comparison between the tumor and the control is carried out on the basis of the intensity of the bands. (b–f) In box plots, densitometric analyses of the expression of claudin-1, claudin-2, claudin-4, claudin-5, and claudin-7 in the healthy control tissue of the 60 patients (n = 60) and the tumor tissue (n = 60), normalized and represented with the loading control β-actin (° outlier, * extremal value, significantly different from control p < 0.001, n.s. not significant).

